- Published on
Loki multi-tenants
- Authors
- Name
- Jay


Application Log를 분리
OpenTelemetry Collector와 Loki를 통해서 Application Log들을 수집하고, Grafana Explore를 통해서 Application Log들을 검색하고 확인할 수 있다. 그런데 Grafana Explore를 볼 수 있는 Application Log 종류를 제한하고 싶은 경우에는 어떻게 해야 할까? 예를 들어서 Grafana Account A는 Kubernetes의 main namespace안의 Pod log들만 볼 수 있게 제한하고, Grafana Account B는 Kubernetes의 test namespace에서 생성되는 log만 볼 수 있게 제한하고 싶다.
Grafana Enterprise의 경우에는 Label-based access control 기능을 제공하여, 특정한 Label이 있는 경우만 볼 수 있도록 권한 설정이 가능한 것으로 보인다. 하지만 아쉽게도 오픈소스에서 해당 기능을 제공하지 않는다.
오픈소스를 사용하는 경우에는 Loki에서 Multi-tenancy 기능을 사용하여 분리를 고려할 수 있다. Loki에서 Log를 수집할 때 tenant별로 묶어서 저장하고, query를 할 때 해당 tenant 그룹에 속한 Log들만 가져올 수 있다. 그렇게 하기 위해서 Loki HTTP endpoint /loki/api/v1/push로 요청할 때, Header X-Scope-OrgID 값에 tenant 식별정보를 담아서 보내면 된다.
Grafana Loki is a multi-tenant system; requests and data for tenant A are isolated from tenant B. Requests to the Loki API should include an HTTP header (X-Scope-OrgID) that identifies the tenant for the request.
Loki Multi Tenant System
helm chart 5.42.2 버전 기준
Loki를 Monolithic Mode로 설치하여 테스트한다.
values.yaml
global:
	dnsService: "coredns"
loki:
	auth_enabled: true
	commonConfig:
		replication_factor: 1
	storage:
		type: 'filesystem'
singleBinary:
	replicas: 1
auth_enabled를 false로 설정하면, single tanant를 사용하게 되고, tenant 식별명은 fake가 된다. auth_enabled의 기본값은 true이지만 명시적으로 설정해주었다.
Loki defaults to running in multi-tenant mode. Multi-tenant mode is set in the configuration with auth_enabled: true.
Helm chart의 value값을 확인해보면 아래와 같이 설정되어 있는 것을 확인할 수 있다. Loki에서 log data를 압축해서 저장하게 되는데, 해당 chunk 파일들이 filesystem의 아래 경로로 저장된다.
filesystem:
  chunks_directory: /var/loki/chunks
  rules_directory: /var/loki/rules
아래와 같이 Pod에 접근하여 해당 경로를 확인해보면, tenant 이름별로 Directory가 생긴 것을 확인할 수 있다. 만약 auth_enabled를 false로 했다면, 여기에 fake라는 Directory명으로 파일들이 생성될 것이다.
kubectl exec -it loki-0 -- /bin/sh
ls /var/loki/chunks
주의해야할 점은 auth_enabled은 true로 설정했기 때문에, Loki에 push 요청을 할 때 X-Scope-OrgID 해더값이 없으면 요청이 실패한다.
OpenTelmetry Loki Exporter 설정
OpenTelemetry Collector의 Exporter로 Loki에 Log 데이터를 전달할 경우, Loki Exporter 문서에 설명된 것처럼 tenant 정보를 보낼 수 있다.
고정 tenant 값을 사용할 때는 아래와 같이 전달할 수 있고,
exporters:
  loki:
    endpoint: http://localhost:3100/loki/api/v1/push
    headers:
      'X-Scope-OrgID': staticTenant
변수값을 보내야 하면 아래와 같이 loki.tenant 속성값을 정의할 수 있다. 이렇게 loki.tenant를 설정하면, X-Scope-OrgID header로 해당 값을 전달하게 된다.
processors:
  resource:
    attributes:
      - action: insert
        key: loki.tenant
        value: host.name
opentelemetry-collector Helm chart 0.77.0 버전 기준
opentelemetry-collector Helm chart의 value중에 service, processors, exporters를 아래와 같이 설정할 수 있다. loki.tenant 속성값에 container명을 설정하였다. PR을 보면 Loki index를 설정하는 loki.attribute.labels, loki.resource.labels hint와 더불어서 loki.tenant도 hint로 사용할수 있도록 추가되었다.
service:
	telemetry:
		logs:
			level: info
	pipelines:
		traces:
			receivers:
				- otlp
			exporters:
				- otlp
		metrics:
			receivers:
				- otlp
		logs:
			receivers:
				- filelog
			processors:
				- resource
				- attributes
			exporters:
				- loki
processors:
	attributes:
		actions:
			- action: insert
				key: loki.attribute.labels
				value: level, context, traceID
			- action: insert
				key: loki.tenant
				value: container
	resource:
		attributes:
			- action: insert
				key: loki.format
				value: json
			- action: insert
				key: loki.resource.labels
				value: pod, namespace, container
exporters:
	loki:
		endpoint: http://loki:3100/loki/api/v1/push
이렇게 설정하고 나면, filelog로 수집한 container명이 tenant로 설정될 수 있다.
Grafana Datasource 설정
이제 Loki에서 multi tenant를 사용하도록 설정하였고, Loki에게 log data를 전달하는 OpenTelemetry Collector에서 Tenant 정보를 보내도록 설정하였다. 이제 로그 데이터를 Query 요청을 하는 Grafana의 설정도 변경이 필요하다.
Log data를 Push하는 것 뿐만 아니라, Query 요청할 때도 X-Scope-OrgID 해더 정보를 같이 보내야 한다. 해당 값을 보내지 않으면 Grafana에서 로그를 검색하려고 할 때, no org id 에러 메세지가 뜬다.
Datasource를 정의할 때, 아래와 같이 Header 값을 설정해서 보내주면 된다. 여기 예제에서는 특정 container이름으로만 Query를 할 수 있게 하였다.
datasources.yaml:
	apiVersion: 1
	datasources:
	- name: Loki
		type: loki
		isDefault: true
		access: proxy
		url: http://loki:3100
		basicAuth: false
		secureJsonData:
			httpHeaderValue1: "containerName"
		jsonData:
			httpHeaderName1: "X-Scope-OrgID"
Loki Authentication
Grafana datasource에 Loki를 추가하고, tenant로 묶여 있는 로그들을 불러와서 보았다. 이렇게 Datasource를 Helm chart로 정의해서 배포했을 때는 아래처럼 UI에서 직접 수정할 수가 없다. 따라서 다른 tenant를 보도록 X-Scope-OrgID를 수정할 수가 없다.
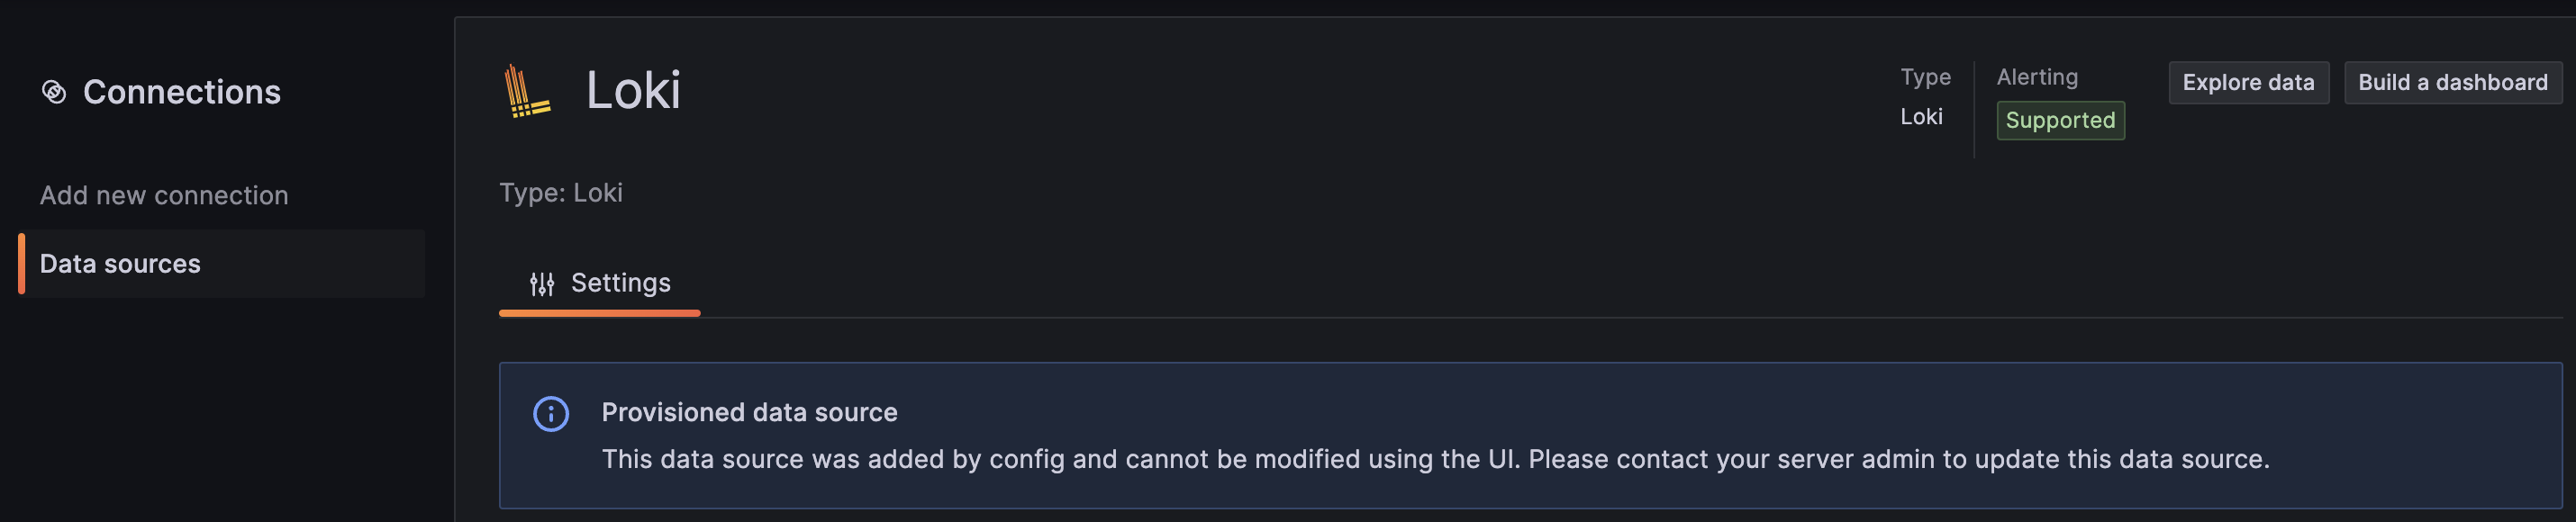
하지만 Grafana에서 datasource를 새롭게 만들 수 있는 Admin 권한을 가지고 있으면, 새로운 Loki connection을 추가하여 설정할 수 있다. Config파일로 정의한 Datasource로만 Log Query를 할 수 있게 제한하고 싶으면 어떻게 해야 할까?
Loki의 문서에 인증 관련 설명이 아래와 같이 있다. Loki에서는 자체적으로 인증 layer를 두고 있지 않고, Helm chart로 설치하게 되면 Nginx가 gateway로 인증 역할을 해줄 수 있다.
Grafana Loki does not come with any included authentication layer.
Loki를 Helm chart을 이용해 Monolithic mode로 배포를 하면, loki-gateway- prefix로 시작하는 pod가 생성되는 것을 확인할 수 있다. Pod의 정보를 보면 아래와 같이 nginx가 설정되어 있는 것을 확인할 수 있다. (보안을 위해서 privileged 권한이 필요없는 nginx-unpriviledged를 사용하고 있다.👍)
Containers:
  nginx:
    Container ID: containerd://0bea78d416e7138fe1e6037b5bfc728191c3951a254d21b4f5a278c381708198
    Image: docker.io/nginxinc/nginx-unprivileged:1.24-alpine
    Image ID: docker.io/nginxinc/nginx-unprivileged@sha256:7bef7e4c99edc6b53e55396fd181288320cfc422c8e3d0beb588c715f7bdc1b0
    Port: 8080/TCP
그리고 kubectl get configmap loki-gateway -o yaml를 확인해보면 configmap에 nginx 설정값이 정의된 것을 확인할 수 있다.
이제 우리는 Loki Gateway를 사용해서 인증을 추가하고, 인증을 통해서만 Loki 해당 tenant 관련 Log 데이터를 가져올 수 있게 할 수 있다. 먼저 Loki Helm chart value에 아래와 같이 추가한다. tenants에 tenant이름과 password를 설정하고, gateway에서 Basic Authentication을 하도록 basicAuth를 enabled한다.
global:
	dnsService: "coredns"
loki:
	auth_enabled: true
	tenants:
	- name: containerName
	  password: somethingPassword
	commonConfig:
	  replication_factor: 1
	storage:
    type: 'filesystem'
gateway:
	basicAuth:
		enabled: true
singleBinary:
	replicas: 1
이렇게 설정하면 loki-gateway ConfigMap data가 아래와 같이 설정된다. auth_basic_user_file이 설정되어서 Basic Authentication으로 인증을 하게 되고, proxy_set_header X-Scope-OrgID $remote_user; 자동으로 Header값에 Basic Authentication을 하는 user명을 넣어서 보내게 된다. 우리는 위에서 containerName username과 somethingPassword로 password를 정의했고, 그것이 /etc/nginx/secrets/.htpasswd 에 설정된다.
nginx.conf: |
	worker_processes  5;  ## Default: 1
	error_log  /dev/stderr;
	pid        /tmp/nginx.pid;
	worker_rlimit_nofile 8192;

	events {
		worker_connections  4096;  ## Default: 1024
	}

	http {
		client_body_temp_path /tmp/client_temp;
		proxy_temp_path       /tmp/proxy_temp_path;
		fastcgi_temp_path     /tmp/fastcgi_temp;
		uwsgi_temp_path       /tmp/uwsgi_temp;
		scgi_temp_path        /tmp/scgi_temp;

		client_max_body_size  4M;

		proxy_read_timeout    600; ## 10 minutes
		proxy_send_timeout    600;
		proxy_connect_timeout 600;

		proxy_http_version    1.1;

		default_type application/octet-stream;
		log_format   main '$remote_addr - $remote_user [$time_local]  $status '
					'"$request" $body_bytes_sent "$http_referer" '
					'"$http_user_agent" "$http_x_forwarded_for"';
		access_log   /dev/stderr  main;

		sendfile     on;
		tcp_nopush   on;
		resolver coredns.kube-system.svc.cluster.local.;
		proxy_set_header X-Scope-OrgID $remote_user;

		server {
			listen             8080;
			listen             [::]:8080;
			auth_basic           "Loki";
			auth_basic_user_file /etc/nginx/secrets/.htpasswd;
			...생략
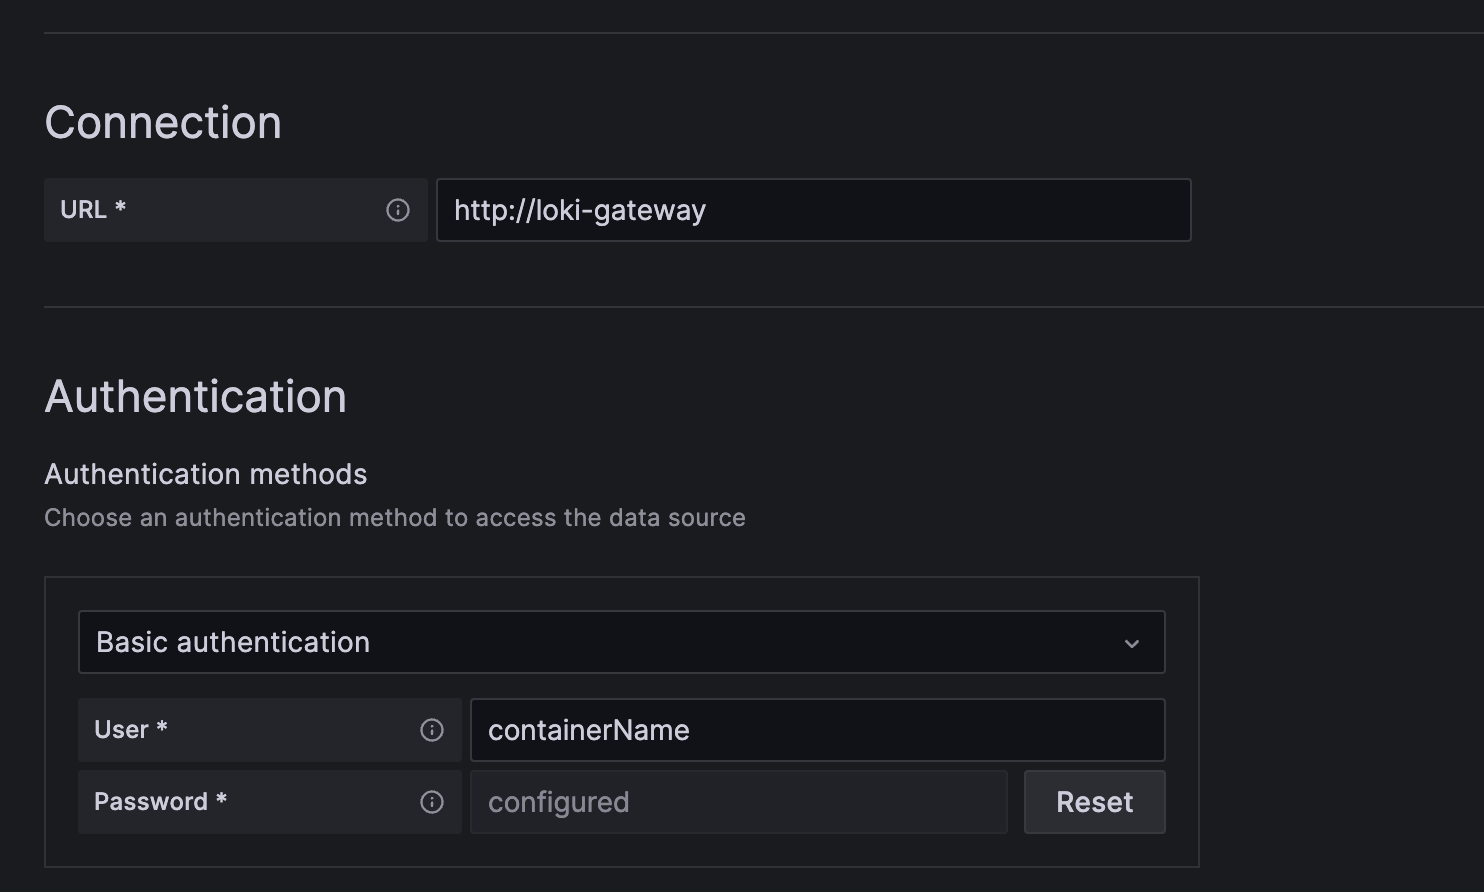
이렇게 인증을 추가했기 때문에 http://loki-gateway를 통해서 접속할 때 아래처럼 인증 관련 정보를 넣어야 한다.
이제 Network Policy로 Grafana에서 인증이 없는 Loki Service로 접근하지 못하도록 막고, Loki Gateway를 통해서 접근하도록 한다. 그러면 해당 tenant의 인증 정보를 알지못하면 연결할 수가 없다. 따라서 Grafana에서 Admin 권한이 있더라도 새로운 connection을 추가해서 다른 tenant의 log에 접근하는 것을 막을 수 있다.
결론
Loki를 통해서 Log 데이터를 수집하고 Query할 때, 사용자에 따라서 어떤 로그에 접근할 수 있는지 제한하고 싶었다. Grafana의 Label-based access control를 통해서 그 목적을 달성할 수 있을 것 같았지만, 해당 기능은 Grafana Enterprise 버전에서만 제공한다. 따라서 Loki의 multi tenant mode를 통해서 log group를 분리하고, Query할 때 해당 log group만 할 수 있도록 하였다. 그리고 Nginx에서 인증을 하여 해당 tenant의 log group에 접근할 수 있도록 하였다.