- Published on
OpenTelemetry with Minikube
- Authors
- Name
- Jay


Minikube 환경
Mac에서 Minikube를 사용하였기 때문에 아래와 같이 Minikube cluster를 실행하였다.
brew install hyperkit
minikube start --container-runtime=containerd --cni=cilium --driver=hyperkit --kubernetes-version=v1.26.12
예제 소스코드을 Clone한다.
Loki, Tempo, Grafana
테스트를 위해서 Loki, Tempo, Grafana를 Helm으로 실행한다.
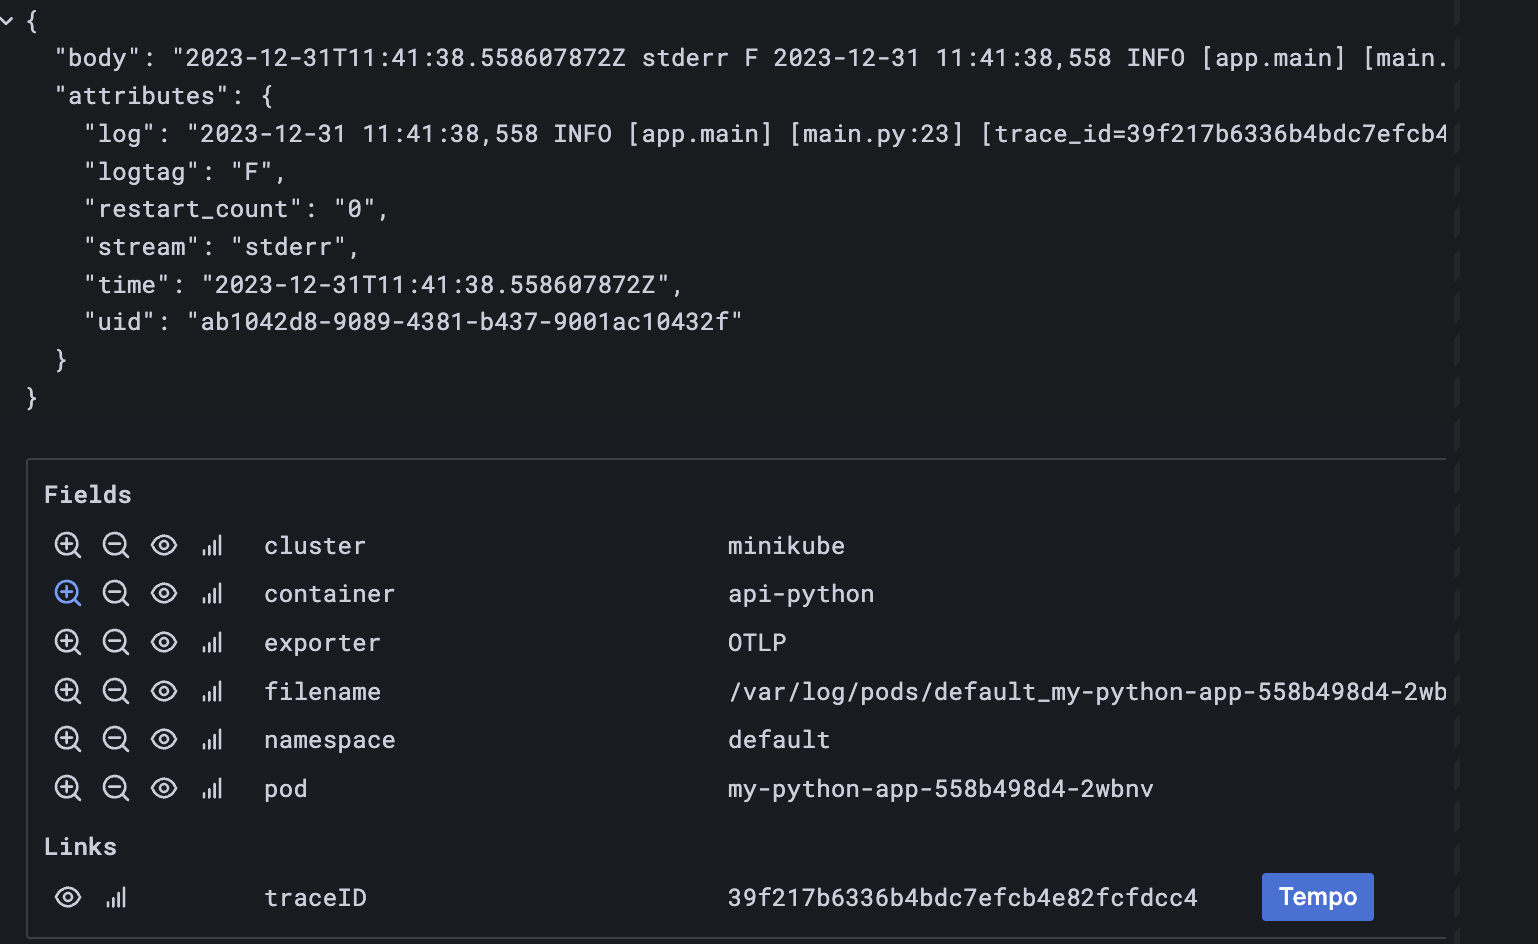
Grafana에서 Lok와 Tempo를 아래와 같이 datasource로 정의해준다. 여기서 trace_id를 regex로 찾아서 tempo에서 보여줄 수 있도록 해줄 수 있다. 그렇게 설정하고 나면 아래 그림처럼 label에 link를 추가할 수 있고, 누르면 바로 Tracing 정보를 같이 볼 수 있다. Grafana Labs에서 이렇게 OSS로 제공하여 우리가 쉽게 사용할 수 있다라는 것에 다시 한번 감탄과 감사함을 느낀다. 😍
values.yml
datasources:
  datasources.yaml:
    apiVersion: 1
    datasources:
      - name: Loki
        type: loki
        access: proxy
        url: http://loki:3100
        basicAuth: false
        jsonData:
          maxLines: 1000
          derivedFields:
            - datasourceName: Tempo
              datasourceUid: tempo
              matcherRegex: trace_id=(\w+)
              name: traceID
              url: $${__value.raw}
      - name: Tempo
        type: tempo
        access: proxy
        orgId: 1
        url: http://tempo:3100
        basicAuth: false
        isDefault: false
        version: 1
        editable: false
        apiVersion: 1
        uid: tempo
helm repo add grafana https://grafana.github.io/helm-charts
helm install loki grafana/loki --values helm/loki/values.yml
helm install tempo grafana/tempo
helm install grafana grafana/grafana --values helm/grafana/values.yml
OpenTelemetry Collector
OpenTelemetry Collector는 receiver, processor, exporter로 구성되어 있다. Log는 filelog receiver를 사용하여, Kubernetes log file의 log를 수집한다. Tracing은 otlp receiver가 OpenTelemetry Protocol로 받을 수 있게 grpc, http 서버를 띄우게 된다. Nestjs Nodejs App에서 해당 otlp receiver로 tracing 정보를 보내게 되고, FastAPI Python App에서도 동일하게 otlp receiver로 tracing 정보를 보내게 된다. 이렇게 수집한 Log는 exporter로 Loki backend에 최종적으로 보내고, Trace는 exporter로 Tempo에 보낸다. 이렇게 보내진 정보는 Grafana에서 Visualize하여 보게 된다. Log는 Processor에서 parsing을 하고, Loki에서 indexing을 하는 label정보를 추가 해주는 작업을 한다.
최종적으로 Helm values값은 아래와 같다. jaeger, prometheus, zipkin은 사용하지 않아서 default값으로 실행되지 않게 null로 설정을 해주었다. Tracing의 경우에 OpenTelemetry Collector가 정상적으로 받았는지 확인하기 위해서 exporters에 debug를 추가하였다.
values.yml
config:
  receivers:
    jaeger: null
    prometheus: null
    zipkin: null
    filelog:
      include:
        - /var/log/pods/*/*/*.log
      start_at: beginning
      include_file_path: true
      include_file_name: false
      operators:
        # Find out which format is used by kubernetes
        - type: router
          id: get-format
          routes:
            - output: parser-containerd
              expr: 'body matches "^[^ Z]+Z"'
        # Parse CRI-Containerd format
        - type: regex_parser
          id: parser-containerd
          regex: '^(?P<time>[^ ^Z]+Z) (?P<stream>stdout|stderr) (?P<logtag>[^ ]*) ?(?P<log>.*)$'
          output: extract_metadata_from_filepath
          timestamp:
            parse_from: attributes.time
            layout: '%Y-%m-%dT%H:%M:%S.%LZ'
        # Extract metadata from file path
        - type: regex_parser
          id: extract_metadata_from_filepath
          regex: '^.*\/(?P<namespace>[^_]+)_(?P<pod_name>[^_]+)_(?P<uid>[a-f0-9\-]{36})\/(?P<container_name>[^\._]+)\/(?P<restart_count>\d+)\.log$'
          parse_from: attributes["log.file.path"]
          cache:
            size: 128 # default maximum amount of Pods per Node is 110
        # Rename attributes
        - type: move
          from: attributes["log.file.path"]
          to: resource["filename"]
        - type: move
          from: attributes.container_name
          to: resource["container"]
        - type: move
          from: attributes.namespace
          to: resource["namespace"]
        - type: move
          from: attributes.pod_name
          to: resource["pod"]
        - type: add
          field: resource["cluster"]
          value: 'minikube'
  service:
    pipelines:
      traces:
        receivers:
          - otlp
        exporters:
          - debug
          - otlp
      metrics:
        receivers:
          - otlp
      logs:
        receivers:
          - filelog
        processors:
          - resource
        exporters:
          - loki
  processors:
    resource:
      attributes:
        - action: insert
          key: loki.format
          value: json
        - action: insert
          key: loki.resource.labels
          value: pod, namespace, container, cluster, filename
  exporters:
    loki:
      endpoint: http://loki.default.svc.cluster.local:3100/loki/api/v1/push
    otlp:
      endpoint: tempo.default.svc.cluster.local:4317
      tls:
        insecure: true
    debug:
      verbosity: detailed
ports:
  jaeger-compact:
    enabled: false
  jaeger-thrift:
    enabled: false
  jaeger-grpc:
    enabled: false
  zipkin:
    enabled: false
mode: daemonset
presets:
  logsCollection:
    enabled: true
    storeCheckpoints: true
OpenTelemetry를 Agent 방식으로 배포를 한다. 그래서 DaemonSet으로 opentelemetry-collector-agent가 생성된다.
helm repo add open-telemetry https://open-telemetry.github.io/opentelemetry-helm-charts
helm install opentelemetry-collector open-telemetry/opentelemetry-collector \
--values helm/opentelemetry-collector/values.yml
App
이제 우리가 수집하려는 Application에서 Log, Trace, Metric 정보를 제공해야 한다. 여기서 Instrumentation을 통해서 source 코드를 일일이 수정해서 Trace 정보를 넣어주지 않아도 Trace 정보를 생성할 수 있다.
Nodejs
Nestjs를 사용하고 잇는데, @opentelemetry/instrumentation-nestjs-core처럼 imstumentation library를 제공하고 있어서 사용할 수 있다.
import { NodeSDK } from '@opentelemetry/sdk-node'
import { OTLPTraceExporter } from '@opentelemetry/exporter-trace-otlp-http'
import { HttpInstrumentation } from '@opentelemetry/instrumentation-http'
import { ExpressInstrumentation } from '@opentelemetry/instrumentation-express'
import { NestInstrumentation } from '@opentelemetry/instrumentation-nestjs-core'
import { WinstonInstrumentation } from '@opentelemetry/instrumentation-winston'

export const otelSDK = new NodeSDK({
  serviceName: `api-node`,
  traceExporter: new OTLPTraceExporter({
    url: `http://${process.env.NODE_IP}:4318/v1/traces`,
  }),
  instrumentations: [
    new HttpInstrumentation(),
    new ExpressInstrumentation(),
    new NestInstrumentation(),
    new WinstonInstrumentation({
      enabled: true,
      logHook: (_span, record) => {
        record['resource.service.name'] = 'test-service'
      },
    }),
  ],
})

process.on('SIGTERM', () => {
  otelSDK
    .shutdown()
    .then(
      () => console.log('SDK shut down successfully'),
      (err) => console.log('Error shutting down SDK', err)
    )
    .finally(() => process.exit(0))
})
Github에 winston instrumentation libary가 Nestjs에서 의도한대로 작동하지 않는 것에 대한 이슈가 존재하였고, 여기서 추천하는 방식으로 해결을 하게 되었다. Nestjs application을 bootstrap하는 로직에서 WinstonModule로 logger를 설정할 때, printf라는 함수에서 직접 trace정보를 가져와서 주입해주는 방식을 사용했다.
main.ts
import { trace } from '@opentelemetry/api'

async function bootstrap() {
  otelSDK.start()
  const app = await NestFactory.create(AppModule, {
    logger: WinstonModule.createLogger({
      transports: [
        new winston.transports.Console({
          format: winston.format.combine(
            winston.format.timestamp(),
            winston.format.ms(),
            // winston instrumentation library doesn't work in Nestjs.
            // https://github.com/open-telemetry/opentelemetry-js-contrib/issues/1745
            // followed the idea from the issue to fix the problem.
            winston.format.printf((info) => {
              const activeSpan = trace.getActiveSpan()
              const metaData: { span_id?: string, trace_id?: string } = {}
              if (activeSpan) {
                metaData.span_id = activeSpan.spanContext().spanId
                metaData.trace_id = activeSpan.spanContext().traceId
              }
              return `[${info.level.toUpperCase()}] [trace_id=${metaData.trace_id} span_id=${
                metaData.span_id
              }] ${info.message} ${JSON.stringify({
                ...info,
              })}`
            })
          ),
        }),
      ],
    }),
  })
  await app.listen(3000)
}
bootstrap()
Docker로 build한 Image를 minikube 명령어를 사용해서 cluster에 load한다.
docker build -t my-node-app ./my-node-app
minikube image load my-node-app:latest
minikube의 명령어로 image가 정상적으로 load되었는지 확인할 수 있다.
$ minikube image list
docker.io/library/my-node-app:latest
Local에 있는 Image를 사용하기 위해서 imagePullPolicy: Never로 설정을 해준다. OTEL_LOG_LEVEL 환경변수는 Nodejs에서 OpenTelemetry SDK libary의 Debug 로그를 보기 위해서 설정했다. NODE_IP는 OpenTelmetry Collector가 DaemonSet으로 띄고 HostPort를 설정하고 있다. 그래서 Node IP를 환경 변수로 넘겨주었다.
apiVersion: apps/v1
kind: Deployment
metadata:
  name: my-node-app
  namespace: default
spec:
  replicas: 1
  revisionHistoryLimit: 3
  selector:
    matchLabels:
      app: my-node-app
  template:
    metadata:
      labels:
        app: my-node-app
    spec:
      containers:
        - image: my-node-app
          name: api-node
          imagePullPolicy: Never
          ports:
            - name: api-node-port
              containerPort: 3000
          env:
            - name: OTEL_LOG_LEVEL
              value: DEBUG
            - name: NODE_IP
              valueFrom:
                fieldRef:
                  fieldPath: status.hostIP
kubectl apply -f k8s/my-node-app/deployment.yml
kubectl apply -f k8s/my-node-app/service.yml
Python
Python은 FastAPI로 간단한 API 서버를 만들었다. 동일하게 제공하는 intrumentation library를 사용하여 설정하였고, Nodejs는 OpenTelemetry Collector가 연결할 때 http로 열려 있는 4318 포트 연결했지만, 여기에서 grpc로 열려 있는 4317 포트로 연결하였다. Python에서 Log가 Experimental status로 사용할 수 있지만, 동일하게 opentelemetry.instrumentation.logging를 통해서 log에 Trace ID를 남기고 Kubernetes log file을 tail하도록 하였다.
import logging
import os
from opentelemetry import trace
from opentelemetry.sdk.resources import Resource
from opentelemetry.sdk.trace import TracerProvider
from opentelemetry.exporter.otlp.proto.grpc.trace_exporter import OTLPSpanExporter
from opentelemetry.sdk.trace.export import BatchSpanProcessor
from opentelemetry.instrumentation.fastapi import FastAPIInstrumentor
from opentelemetry.instrumentation.logging import LoggingInstrumentor
from fastapi import FastAPI

resource = Resource.create({"service.name": "api-python"})
trace.set_tracer_provider(TracerProvider(resource=resource))
trace.get_tracer_provider().add_span_processor(
    BatchSpanProcessor(OTLPSpanExporter(endpoint=f"http://{os.environ.get('NODE_IP')}:4317"))
)

app = FastAPI()
logger = logging.getLogger(__name__)

@app.get("/")
def read_root():
    logger.info("hello world!")
    return "Hello From Python App!"

FastAPIInstrumentor.instrument_app(app)
LoggingInstrumentor().instrument(set_logging_format=True)
서비스간의 통신을 위해서 예제코드의 Python App도 동일하게 반복한다.
docker build -t my-python-app ./my-python-app
minikube image load my-python-app:latest
kubectl apply -f k8s/my-python-app/deployment.yml
kubectl apply -f k8s/my-python-app/service.yml
서비스간의 통신
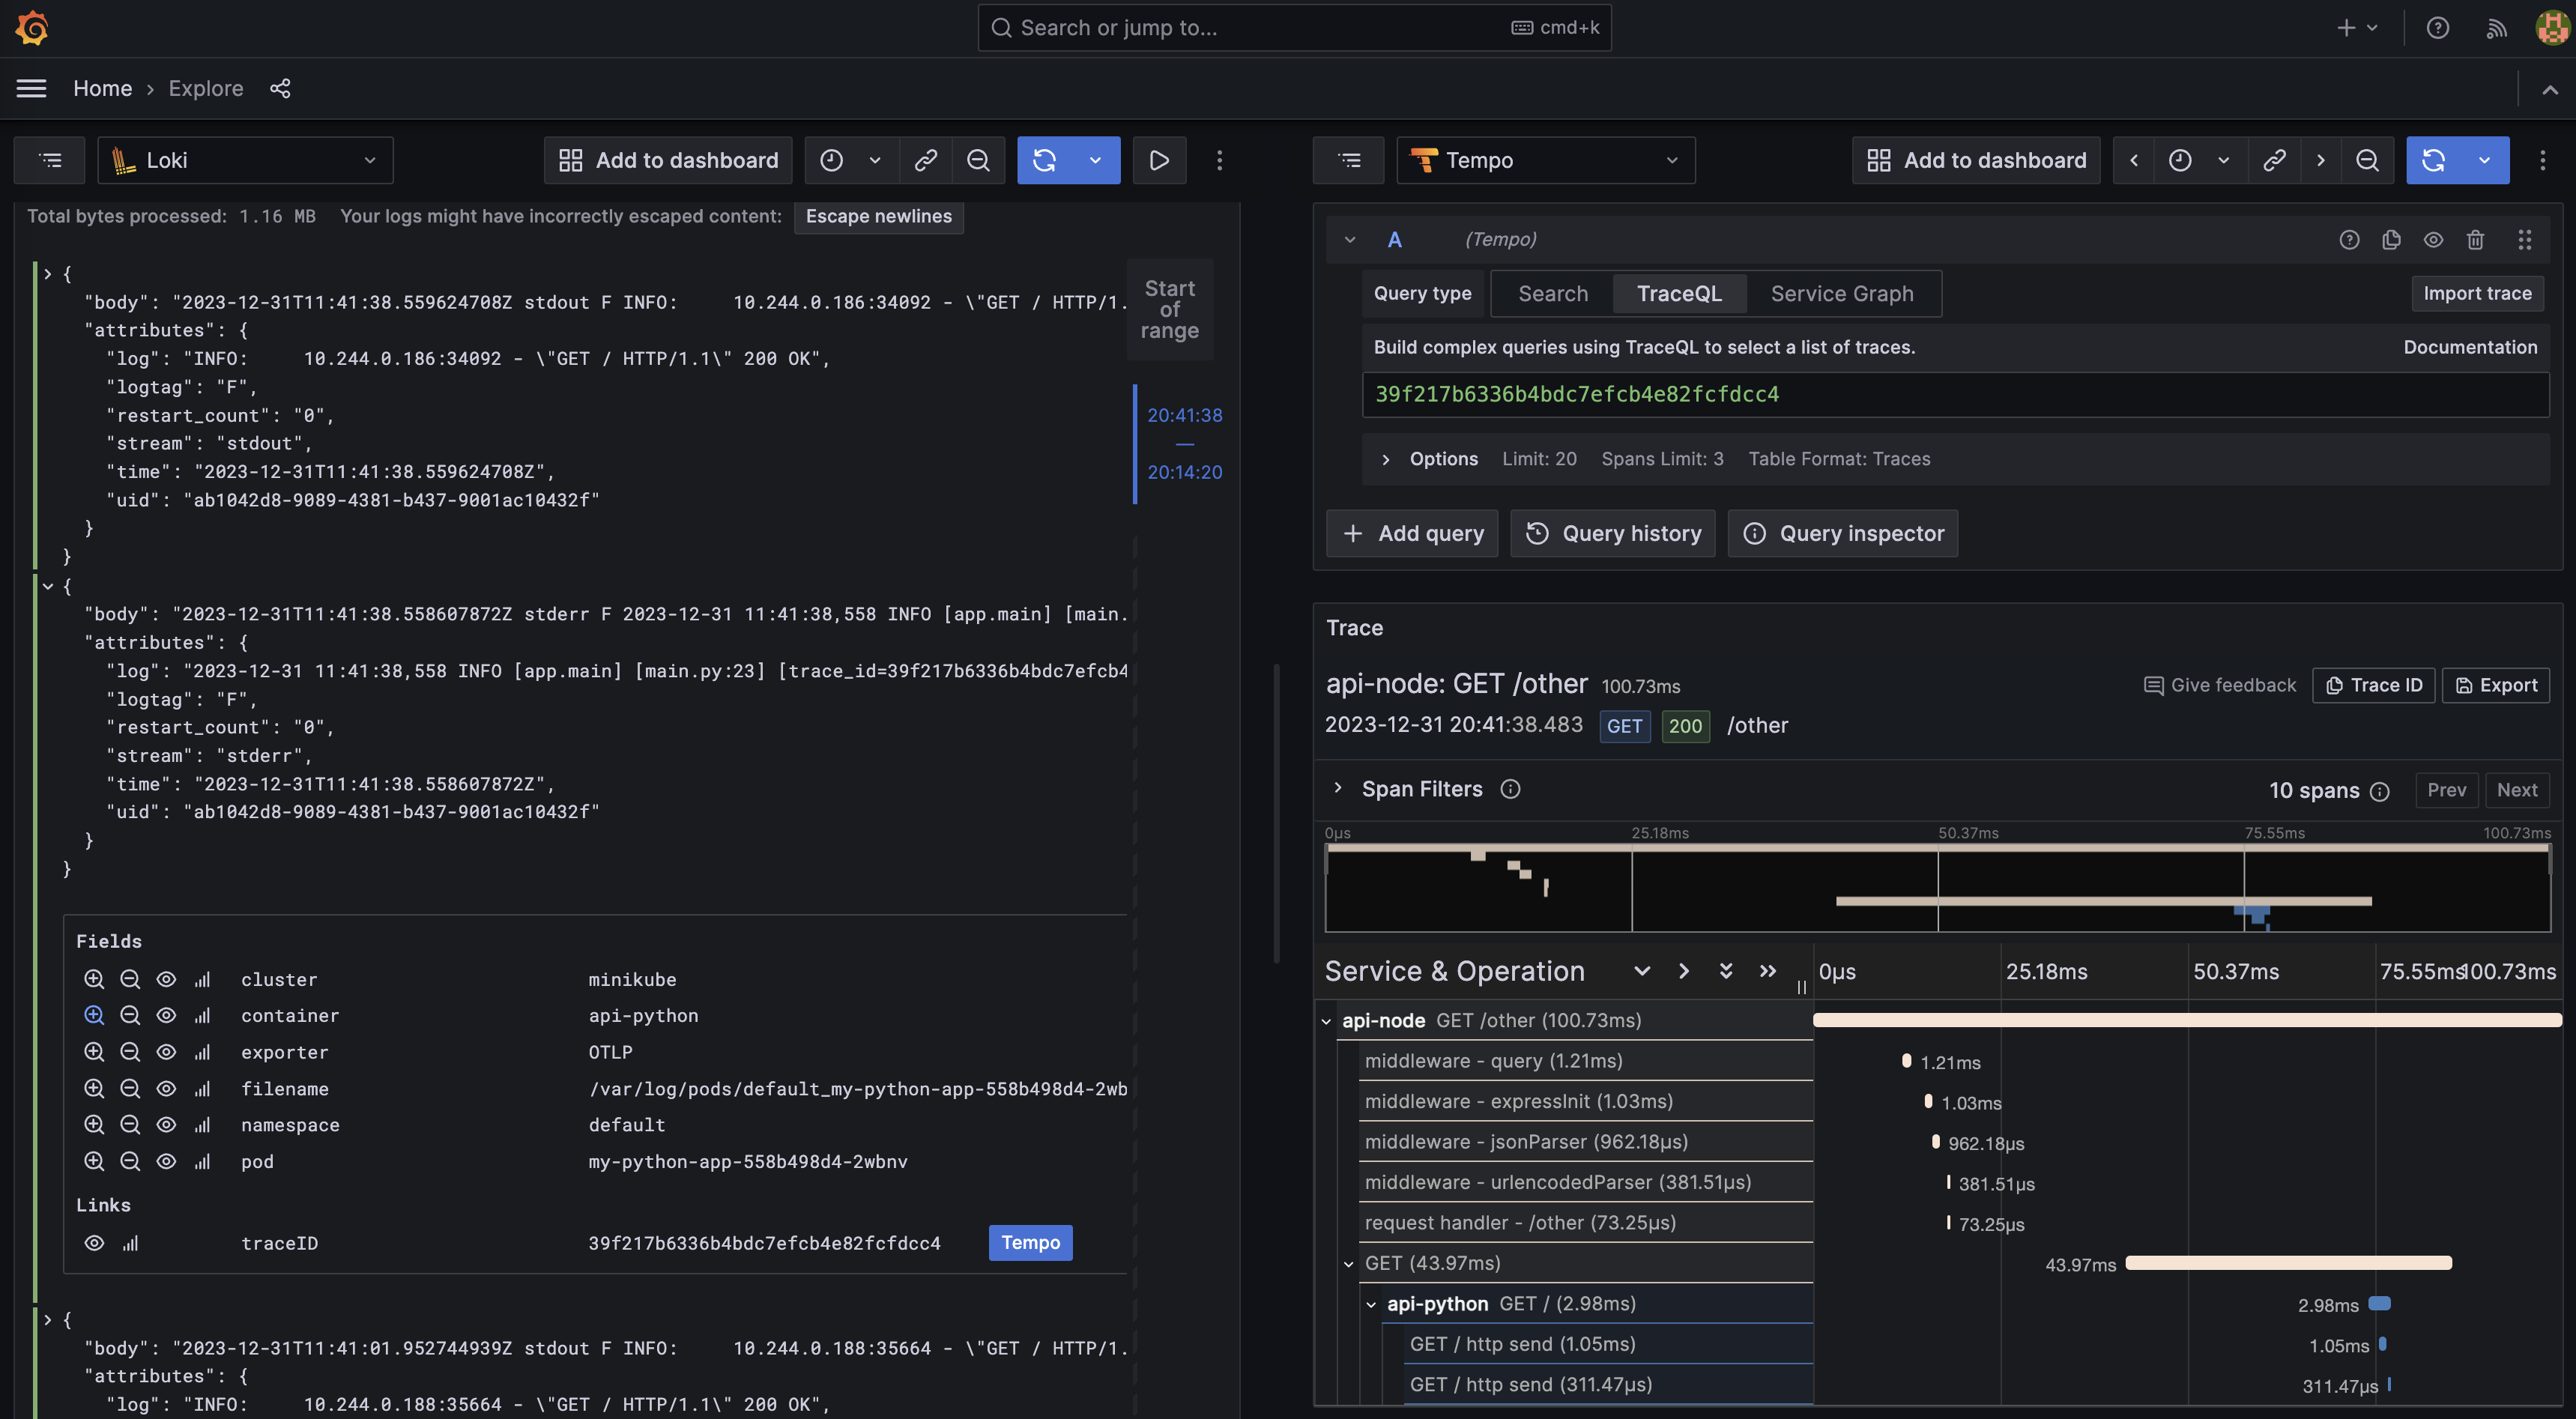
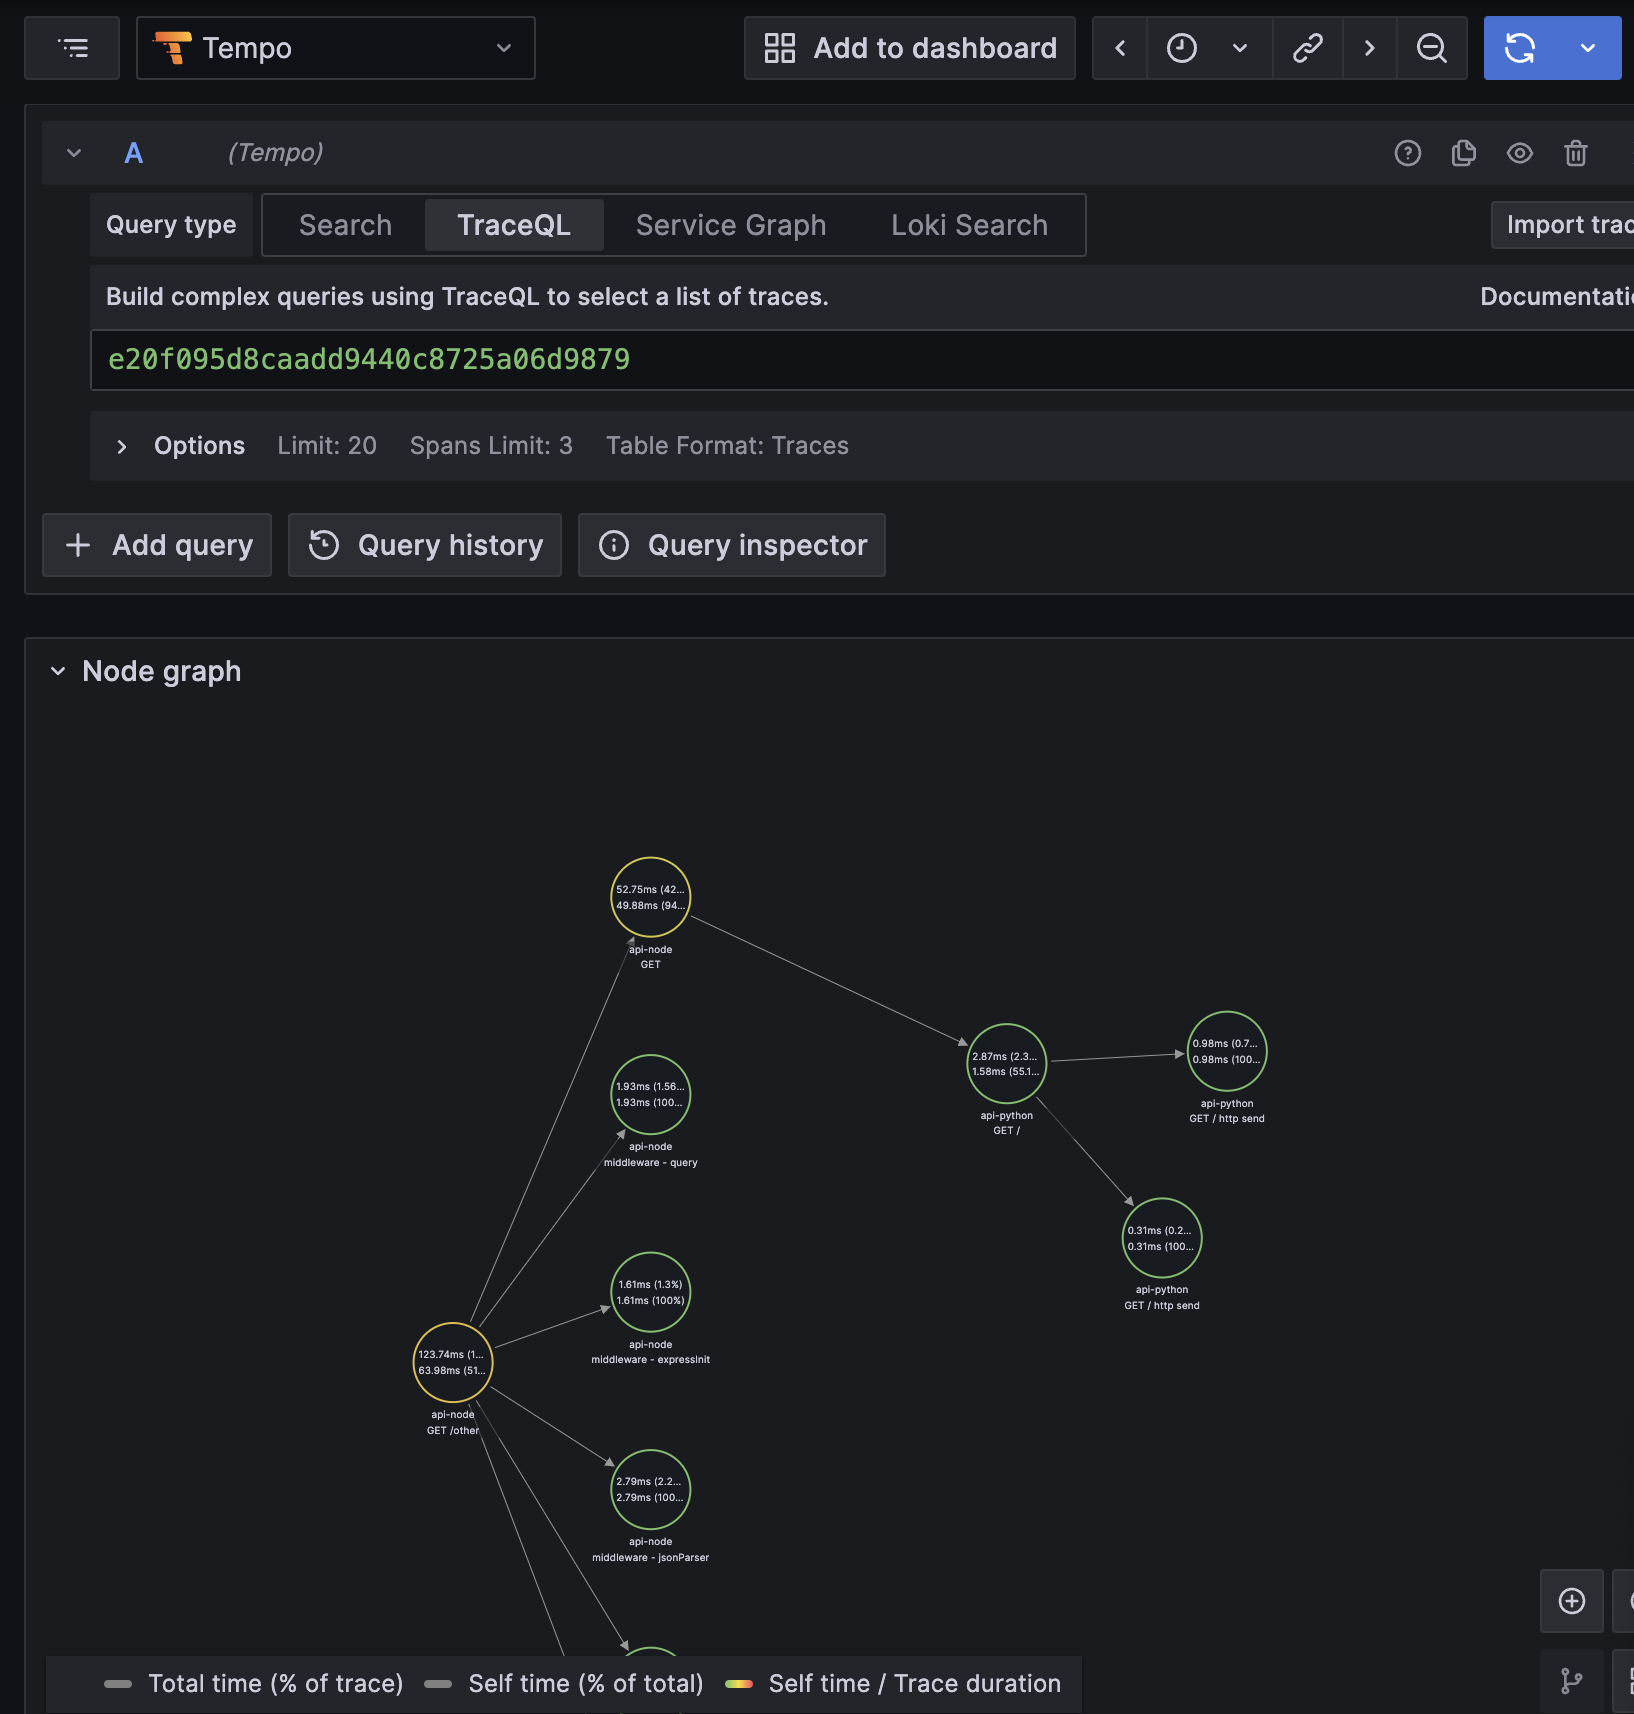
client -> nodejs app -> python app으로 호출하는 것을 실행해본다.
nodejs app Service에 Port Fowarding을 하고 /something에 요청하면 nodejs app이 python app 요청하여 받아온 응답값을 전달하게 된다.
kubectl port-forward svc/my-node-app-svc 3000:3000
curl localhost:3000/something
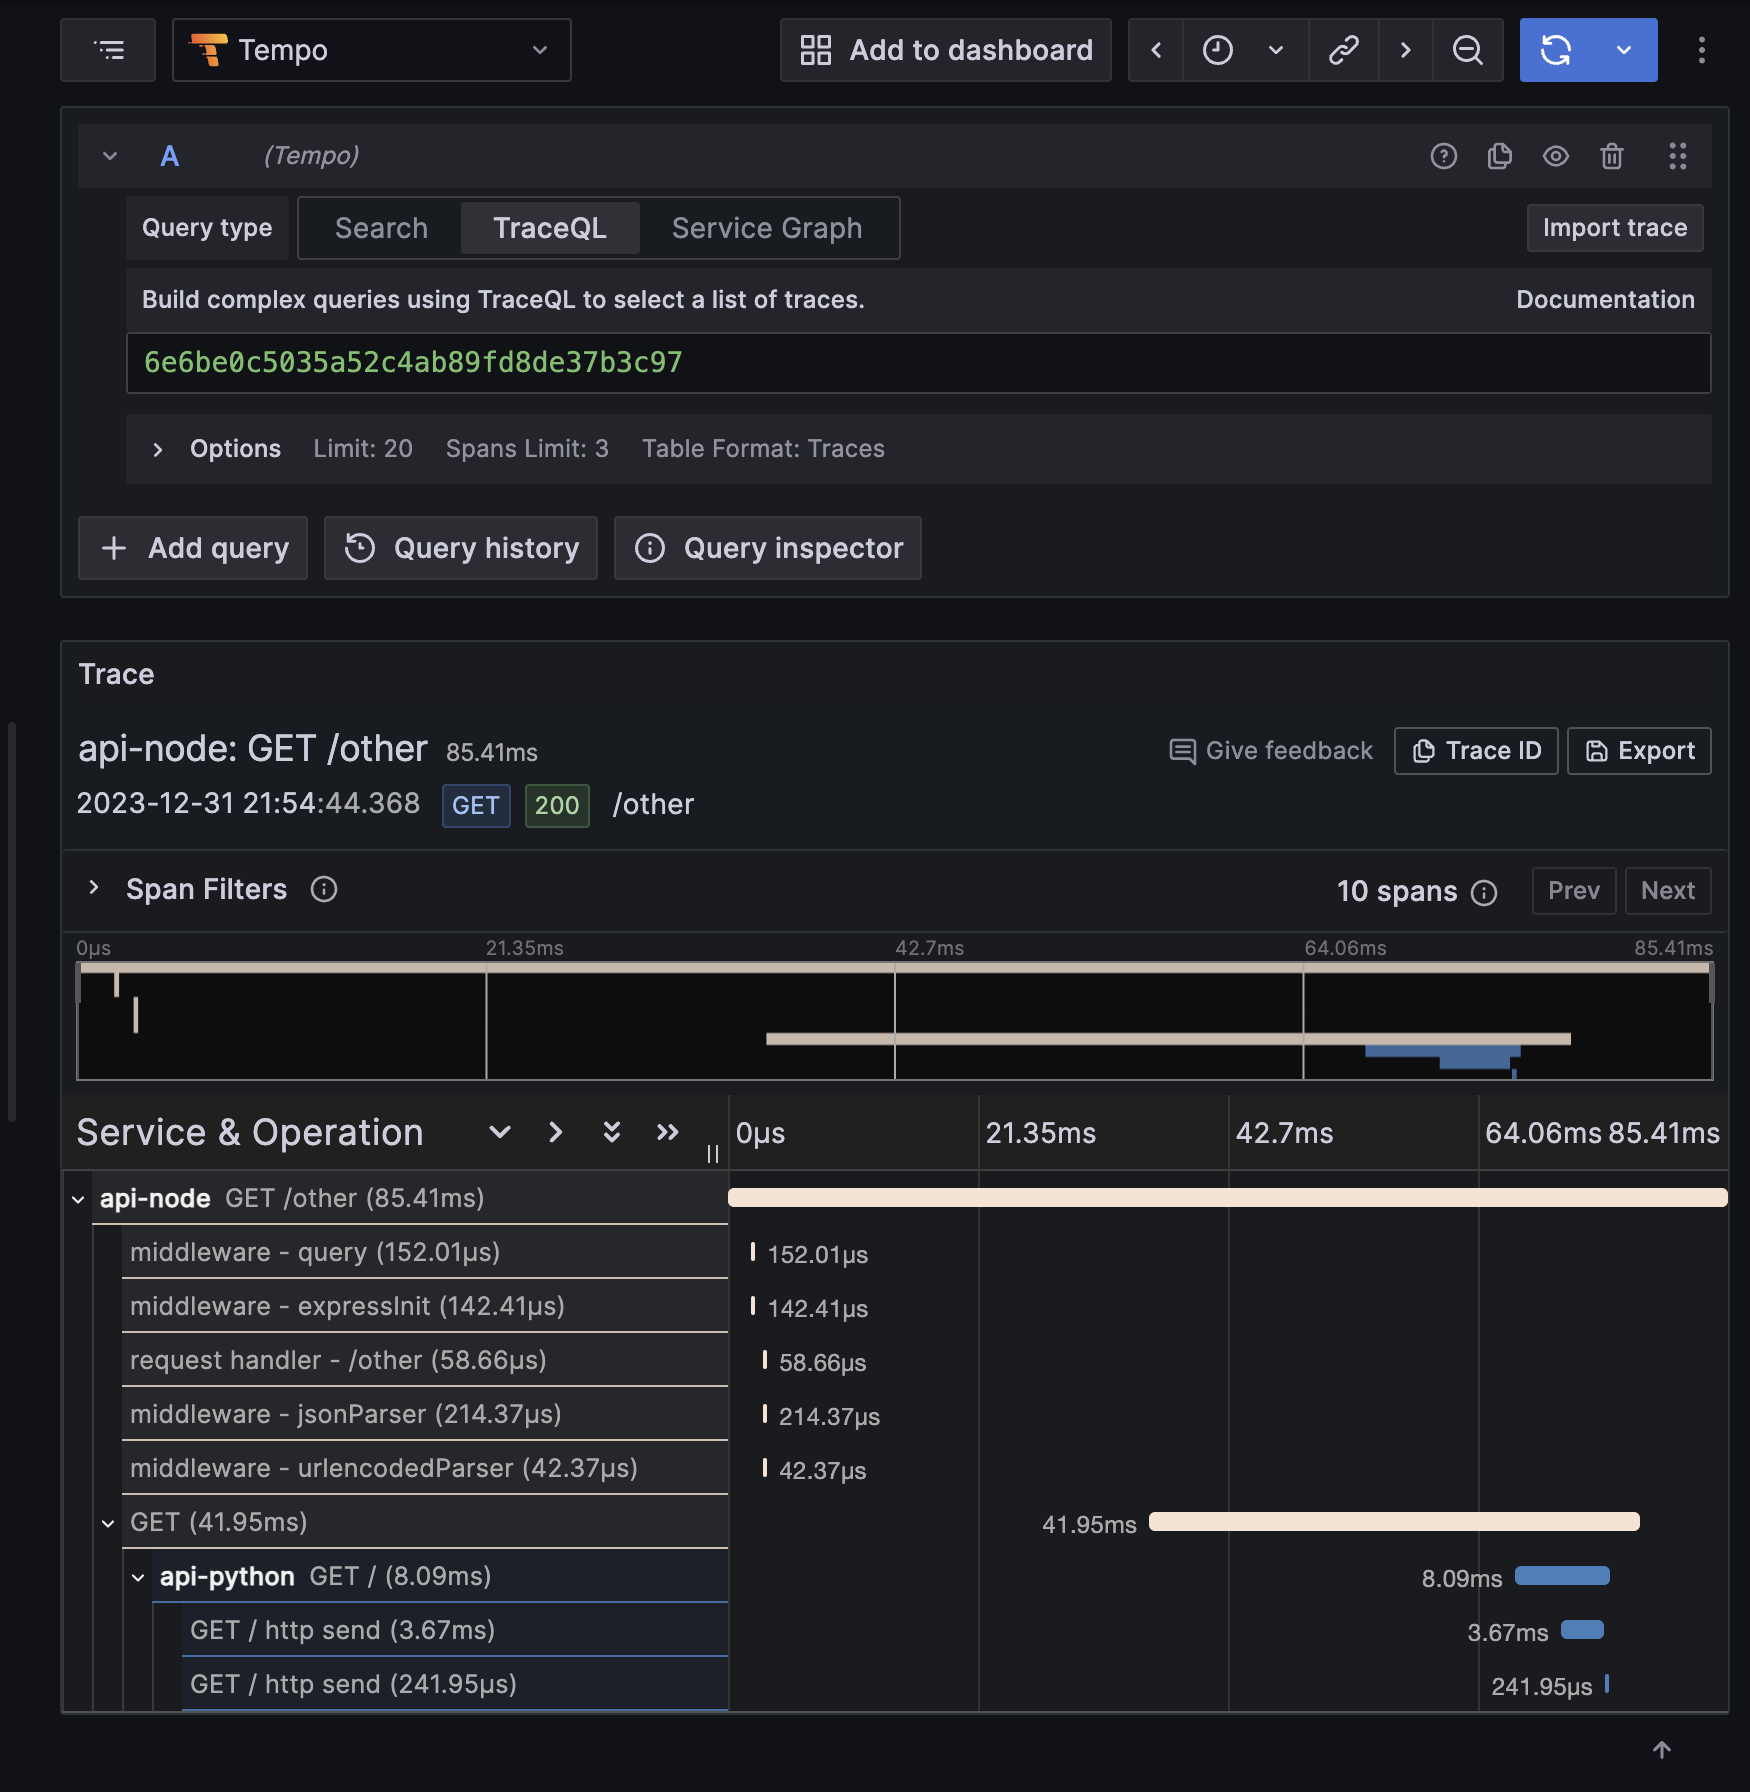
tempo에서 아래와 같이 확인 할 수 있다.
Metric
Metric을 수집하는 방법은 아래와 같이 생각해볼 수 있다.
@opentelemetry/exporter-prometheus로 Prometheus에서 Pull 방식으로 수집
export const otelSDK = new NodeSDK({
  metricReader: new PrometheusExporter({
    port: 9464,
  }),
})
- OpenTelemetry collector가 receiver로 받아서 prometheus exporter로 Pull 방식으로 수집
export const otelSDK = new NodeSDK({
  metricReader: new PeriodicExportingMetricReader({
    exporter: new OTLPMetricExporter({
      url: `http://${process.env.NODE_IP}:4318/v1/metrics`,
    }),
  }),
})
- Prometheus의 OLTP protocol로 바로 받을 수 있는 endpoint로 Push 방식으로 수집
3번째 방법은 올해 여름 Prometheus에서 바로 OLTP protocol로 받을 수 있는 endpoint를 추가가 되어서 사용할 수 있다. 현재 Experimental feature로 제공되고 있다. 이 기능을 사용하기 위해서 아래처럼 otlp-write-receiver를 enable하도록 설정해준다.
values.yml
server:
  extraFlags:
    - enable-feature=otlp-write-receiver
helm repo add prometheus-community https://prometheus-community.github.io/helm-charts
helm install prometheus prometheus-community/prometheus --values helm/prometheus/values.yml
prometheus-server의 로그를 확인하면 아래처럼 해당 feature가 enable되었다는 log를 확인 할 수 있다.
ts=2024-01-03T01:41:21.711Z caller=main.go:175 level=info msg="Experimental OTLP write receiver enabled"
이제 OTLPMetricExporter를 사용하고, url를 promethues 서버로 설정할 수 있다. URL 설정이 좀 헛갈렸는데, otlp의 path를 따라서 /api/v1/otlp/v1/metrics로 지정하면 된다. Github issue에서 해당 feature를 사용하는 Python 예제를 작성하는 것이 있어서 참고할 수 있었다.
export const otelSDK = new NodeSDK({
  serviceName: `api-node`,
  metricReader: new PeriodicExportingMetricReader({
    exporter: new OTLPMetricExporter({
      url: `http://prometheus-server/api/v1/otlp/v1/metrics`,
    }),
  }),
  traceExporter: new OTLPTraceExporter({
    url: `http://${process.env.NODE_IP}:4318/v1/traces`,
  }),
  instrumentations: [
    new HttpInstrumentation(),
    new ExpressInstrumentation(),
    new NestInstrumentation(),
    new WinstonInstrumentation(),
  ],
})
이제 정상적으로 Metric이 Prometheus에 수집되고, Grafana로 확인할 수 있다.
위에서 Grafana values.yml에 Tempo를 추가하였는데, traceToLogsV2와 traceToMetrics 설정을 이용하면 추가적으로 Trace에서 설정된 페이지로 이동할 수가 있다.
- name: Tempo
  type: tempo
  access: proxy
  orgId: 1
  url: http://tempo:3100
  basicAuth: false
  isDefault: false
  version: 1
  editable: false
  apiVersion: 1
  uid: tempo
  jsonData:
    tracesToLogsV2:
      datasourceUid: 'Loki'
      spanStartTimeShift: '1h'
      spanEndTimeShift: '-1h'
      tags: [{ key: 'service.name', value: 'container' }]
      filterByTraceID: false
      filterBySpanID: false
      customQuery: true
      query: '{$${__tags}} |="$${__span.traceId}"'
    tracesToMetrics:
      datasourceUid: 'Prometheus'
      spanStartTimeShift: '1h'
      spanEndTimeShift: '-1h'
      tags: [{ key: 'service.name', value: 'job' }]
      queries:
        - name: 'Sample query'
          query: 'sum(rate(http_server_duration_milliseconds_bucket{$$__tags}[5m]))'
아래 그림처럼 Tempo Trace정보에서 related log와 Sample query라는 메뉴를 펼쳐 볼수가 있게 된다.
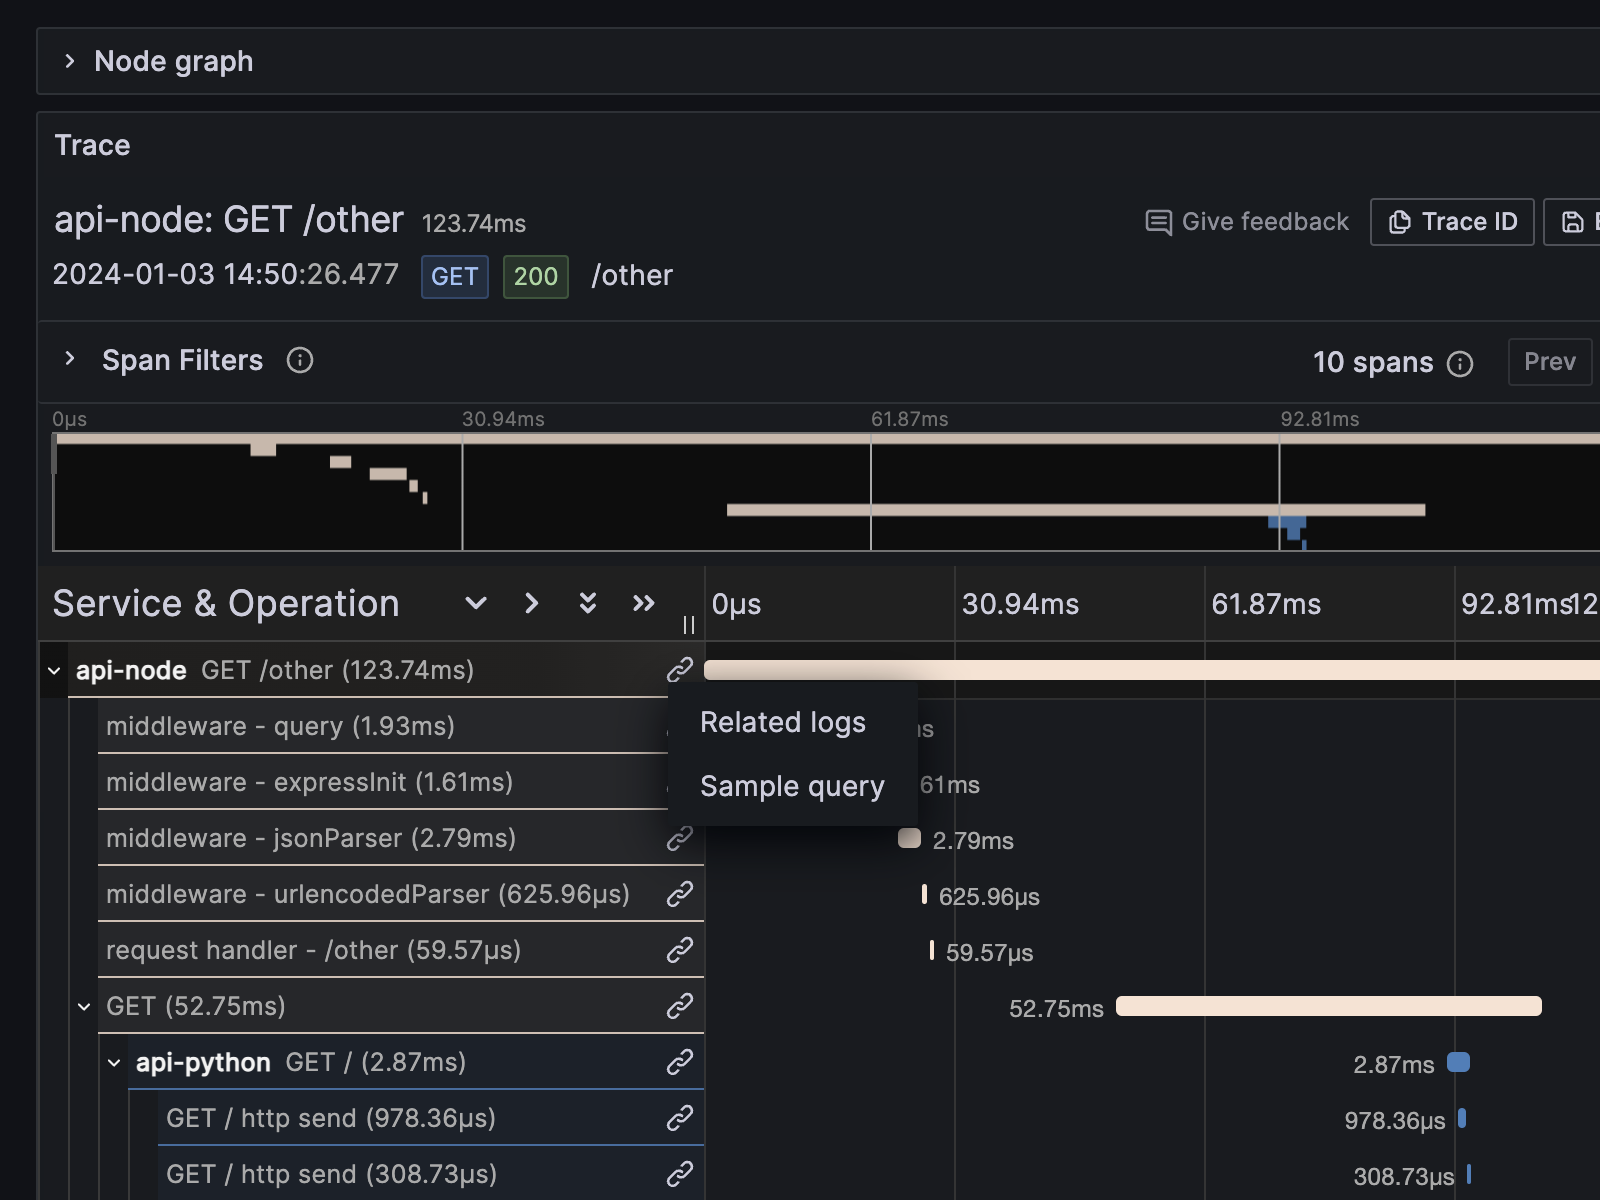
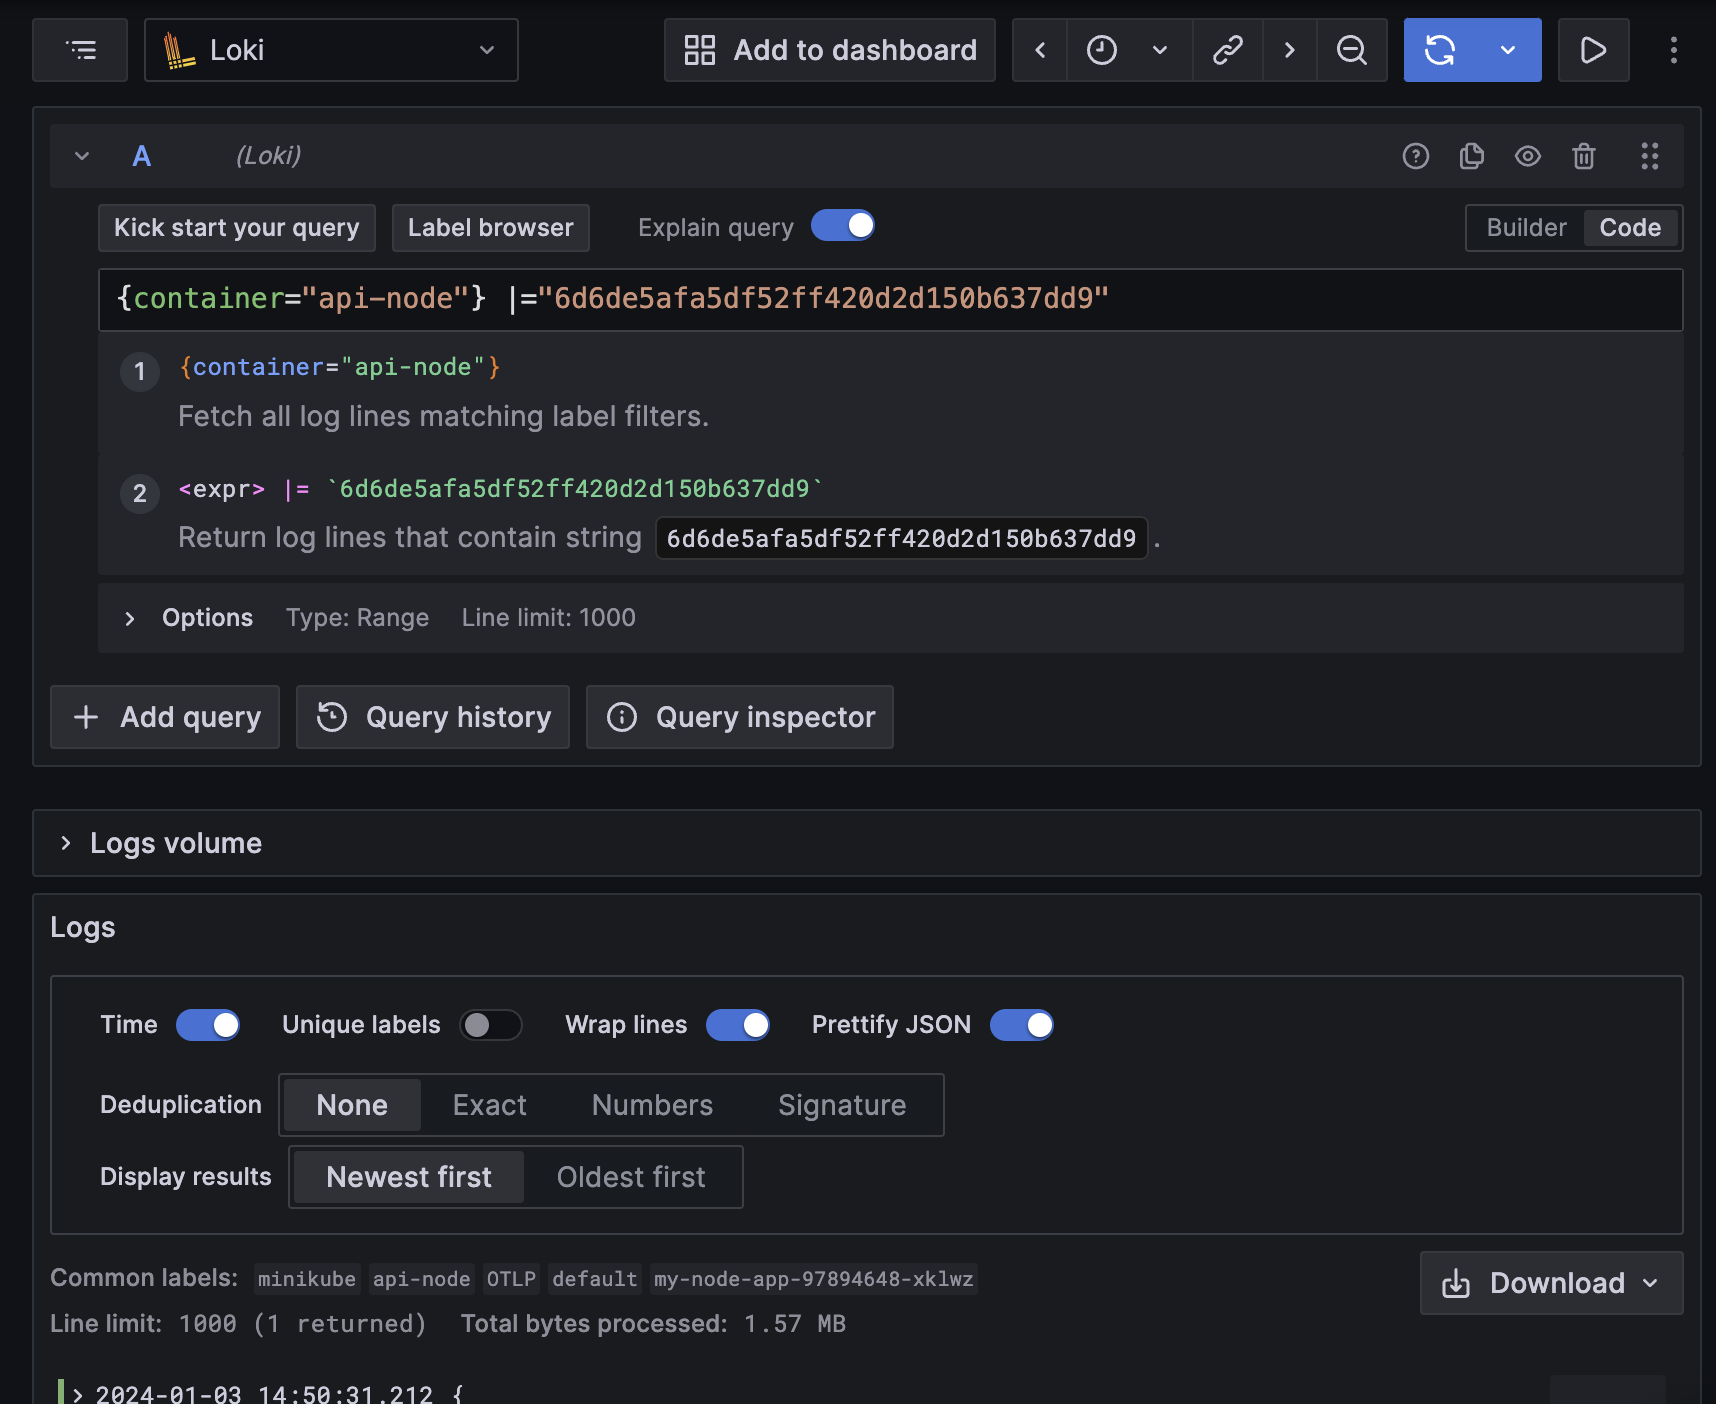
related log를 클릭하면 아래와 같이 설정에서 정의한 '{$${__tags}} |="$${__span.traceId}"' 형식대로 바로 쿼리해서 보여주게 된다.
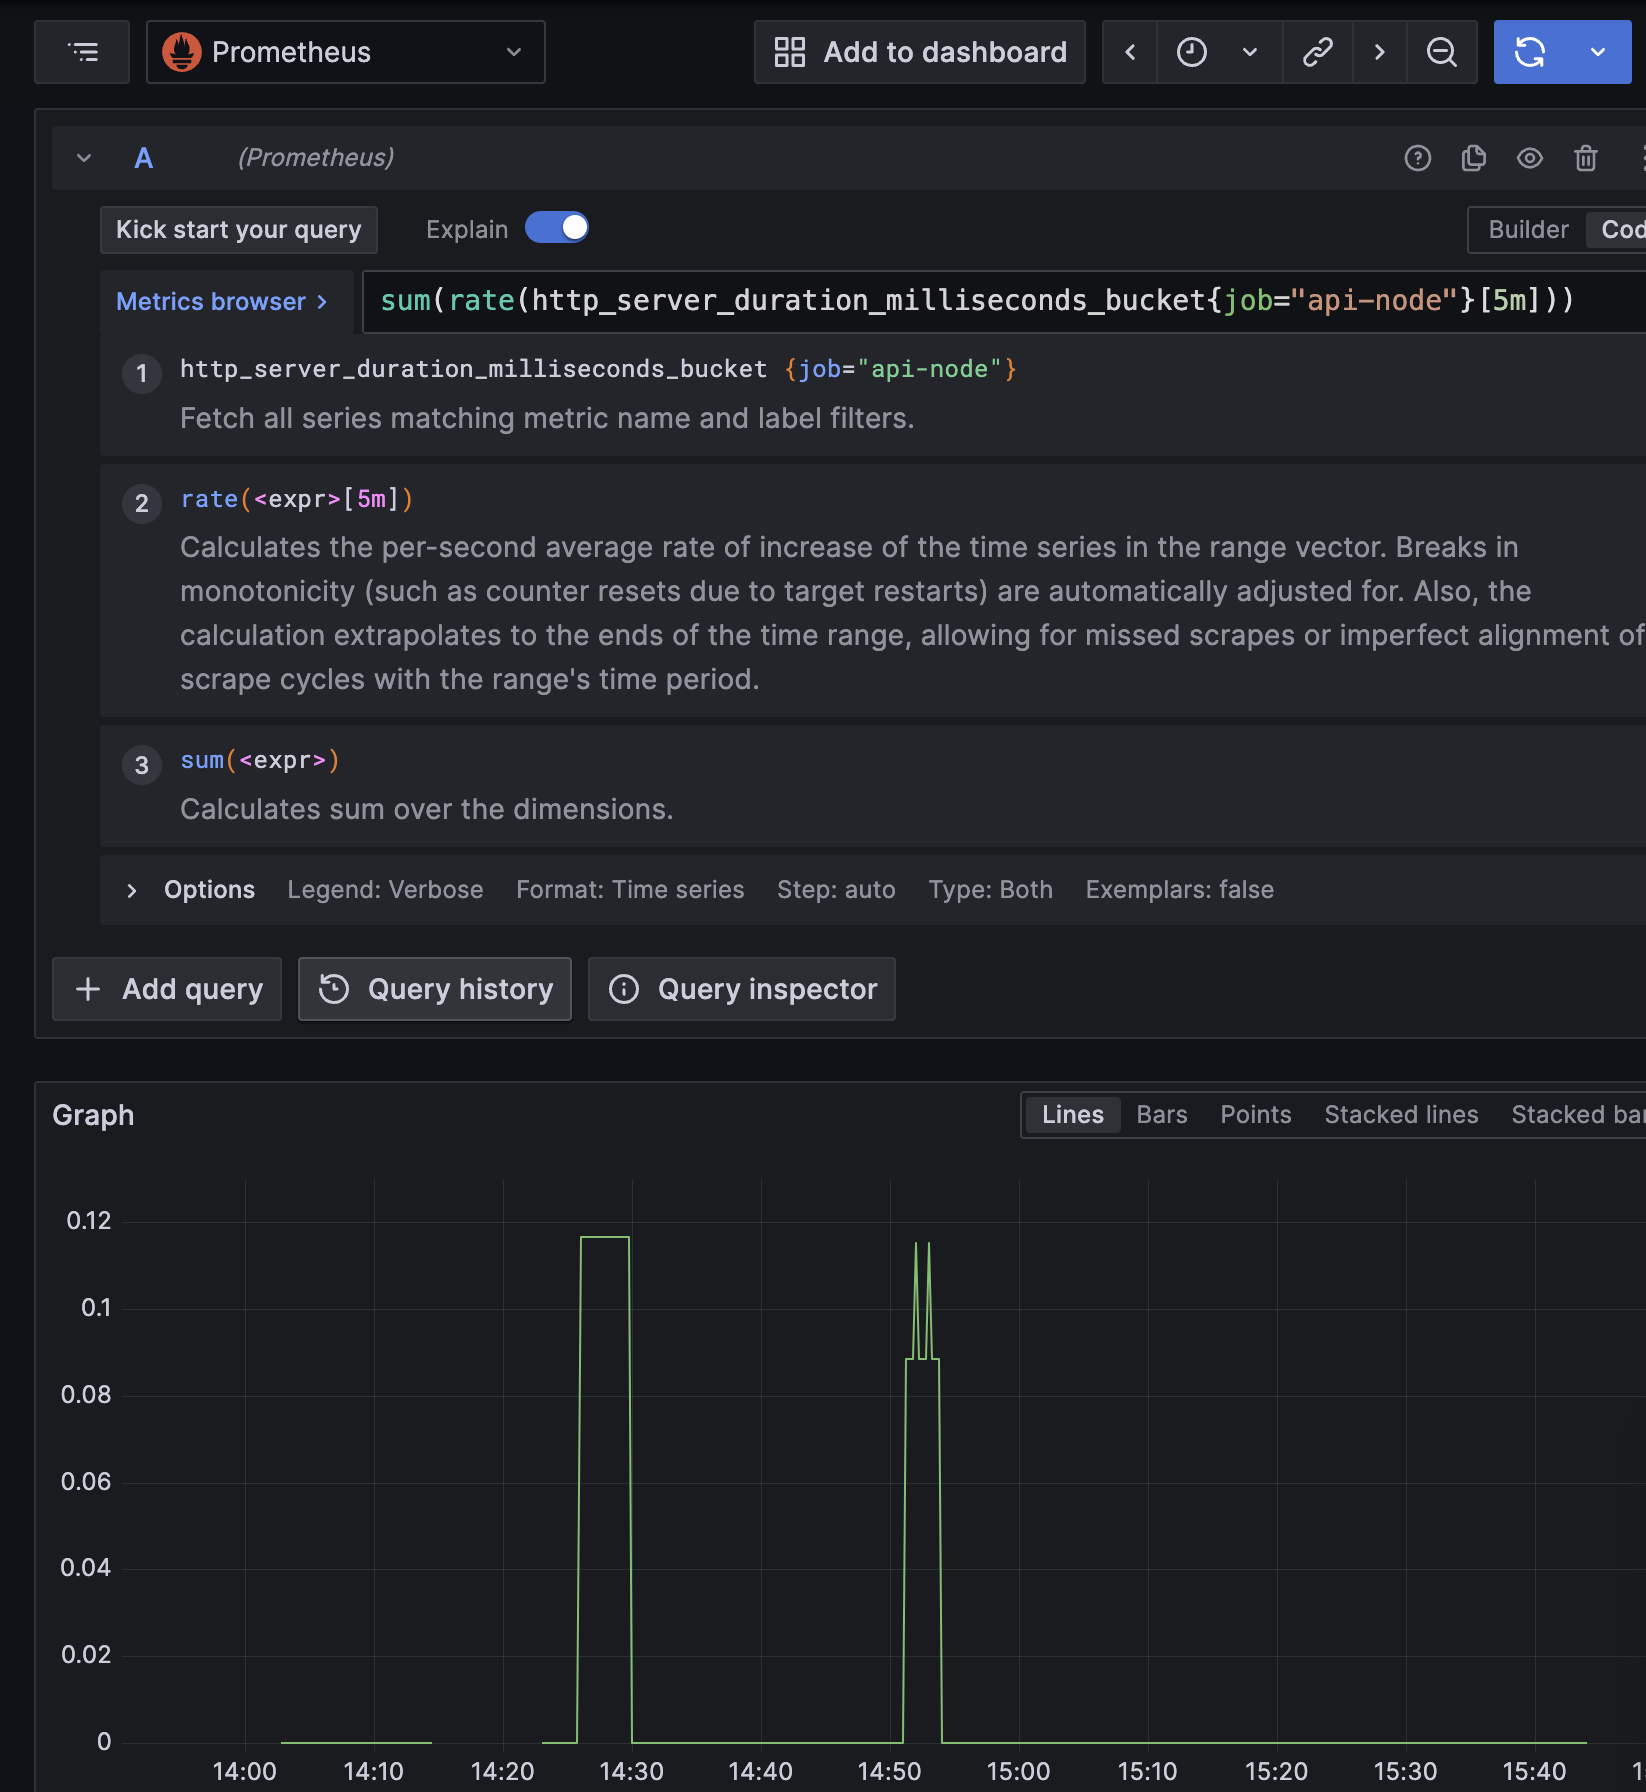
Sample query를 클릭하면 마찬가지로 설정에서 정의한 쿼리로 보여주게 된다.
그리고 nodeGraph를 enable하여 아래처럼 어떻게 호출되고 있는지 Graph로 볼 수도 있다.
- name: Tempo
  # ...생략
  nodeGraph:
    enabled: true
아직 개발되지 않은 기능들
Node runtime의 metric을 Instrumentation library로 쉽게 받으면 좋겠다 싶어서 찾아봤지만, 아직 Github issue에 요청으로 남아 있는 상태이다. 대안으로 prom-client defaultMetric을 수집하도록 하여 별도록 Prometheus 포멧으로 따로 가져올 수 있겠다. Nodejs eventloop lag이나 GC관련 metric을 default로 쉽게 가져올 수 있다. 아래처럼 Nestjs에 추가하고, Prometheus scrape config로 PULL 방식으로 가져오도록 할 수 있겠다.
service.ts
import { Injectable, OnModuleInit } from '@nestjs/common';
import * as client from 'prom-client';

@Injectable()
export class PrometheusService implements OnModuleInit {
  private register: client.Registry;

  onModuleInit() {
    const defaultLabels = { service: 'node-api' };
    const collectDefaultMetric = client.collectDefaultMetrics;
    const Registry = client.Registry;
    const register = new Registry();
    register.setDefaultLabels(defaultLabels);
    collectDefaultMetric({ register });
    this.register = register;
  }

  getRegister() {
    return this.register;
  }
}
controller.ts
@Controller('prometheus')
export class PrometheusController {
  constructor(private readonly prometheusService: PrometheusService) {}

  @Get('metrics')
  getMetrics(@Res() res: Response) {
    const register = this.prometheusService.getRegister();
    res.setHeader('Content-Type', register.contentType);
    register.metrics().then((data) => res.status(200).send(data));
  }
}
그리고 Grafana에서 Exemplar를 통해서 Metric과 관련된 Trace 정보를 바로 찾아 볼 수 있게 하고 싶었다. 하지만 이것도 Github Issue에 요청되어 있는 상태로 남아 있다.
🤓 아직 이해도가 부족하지만 앞으로 오픈소스 프로젝트를 고민할 때 만들어보면 재미있을 것 같다.
Update된 기능
작성할 당시에 grafana Helm chart 버전 7.0.19을 사용했고, 해당 Chart로 Grafana 10.2.2가 설치가 되었다. Loki에서 trace_id가 있는 경우에 바로 Tempo로 이동할 수 있는 버튼을 보여주기 위해서 datasource 설정을 아래와 같이 작성하였다.
datasources:
  - name: Loki
    type: loki
    access: proxy
    url: http://loki:3100
    basicAuth: false
    jsonData:
      maxLines: 1000
      derivedFields:
        - datasourceName: Tempo
          datasourceUid: tempo
          matcherRegex: trace_id=(\w+)
          name: traceID
          url: $${__value.raw}
그리고 regex로 trace_id=(\w+)을 추출하기 위해서 application에서 로그를 남길 때 해당 format으로 아래처럼 남기도록 했었다.
import { trace } from '@opentelemetry/api'

async function bootstrap() {
  otelSDK.start()
  const app = await NestFactory.create(AppModule, {
    logger: WinstonModule.createLogger({
      transports: [
        new winston.transports.Console({
          format: winston.format.combine(
            winston.format.timestamp(),
            winston.format.ms(),
            // winston instrumentation library doesn't work in Nestjs.
            // https://github.com/open-telemetry/opentelemetry-js-contrib/issues/1745
            // followed the idea from the issue to fix the problem.
            winston.format.printf((info) => {
              const activeSpan = trace.getActiveSpan()
              const metaData: { span_id?: string, trace_id?: string } = {}
              if (activeSpan) {
                metaData.span_id = activeSpan.spanContext().spanId
                metaData.trace_id = activeSpan.spanContext().traceId
              }
              return `[${info.level.toUpperCase()}] [trace_id=${metaData.trace_id} span_id=${
                metaData.span_id
              }] ${info.message} ${JSON.stringify({
                ...info,
              })}`
            })
          ),
        }),
      ],
    }),
  })
  await app.listen(3000)
}
bootstrap()
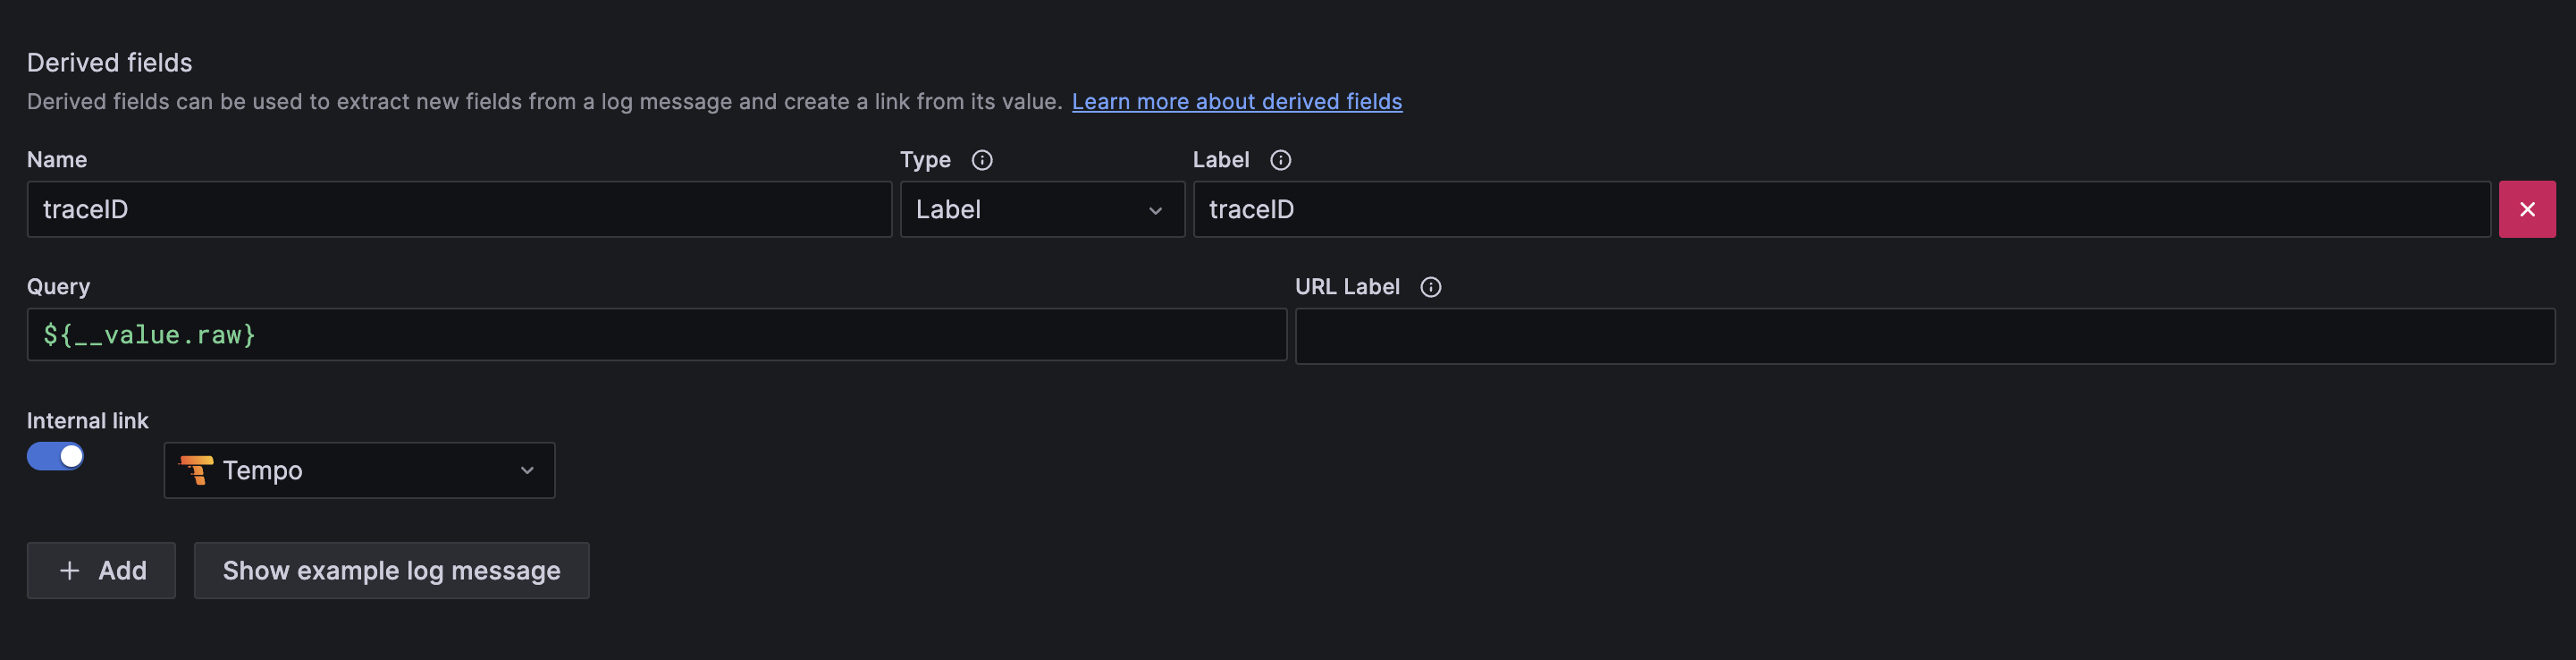
Grafana 10.3.1에 Label에서 TraceID를 가져올 수 있는 기능이 추가된 Commit이 반영된 것을 확인하였다. 소스코드를 확인하면 matcherType이라는 것이 추가된 것을 확인할 수 있다. 그래서 아래와 같이 matcherType을 label로 설정하고, MatcherRegex를 label key인 traceID로 정의하면 label에 있는 traceID로 보여줄 수 있다.
derivedFields:
  - datasourceName: Tempo
    datasourceUid: tempo
    name: traceID
    matcherType: label
    matcherRegex: traceID
    url: $${__value.raw}
Application Code에서는 traceID, spanID를 JSON 형식으로 같이 남겼다.
async function bootstrap() {
  otelSDK.start()
  const app = await NestFactory.create(AppModule, {
    logger: WinstonModule.createLogger({
      transports: [
        new winston.transports.Console({
          format: winston.format.combine(
            winston.format.timestamp(),
            winston.format.ms(),
            // winston instrumentation library doesn't work in Nestjs.
            // https://github.com/open-telemetry/opentelemetry-js-contrib/issues/1745
            // followed the idea from the issue to fix the problem.
            winston.format.printf((info) => {
              const log = info
              const activeSpan = trace.getActiveSpan()
              if (activeSpan) {
                log['spanID'] = activeSpan.spanContext().spanId
                log['traceID'] = activeSpan.spanContext().traceId
              }
              return JSON.stringify(log)
            })
          ),
        }),
      ],
    }),
  })
  await app.listen(3000)
}
bootstrap()
그리고 OpenTelemetry Collect Helm chart의 value에서 loki label을 아래와 같이 추가하도록 변경하였다. operators 마지막에 jsonParser를 통해서 Application이 남긴 JSON 형식의 string log값을 parsing한다. 이렇게 parsing된 JSON 값들은 attributes에 저장되는데, attributes processor를 통해서 loki label값으로 설정해주었다.
config:
  receivers:
    jaeger: null
    prometheus: null
    zipkin: null
    filelog:
      exclude: []
      include:
        - /var/log/pods/dev_aidt-test*/*/*.log
      include_file_name: false
      include_file_path: true
      operators:
        - id: get-format
          routes:
            - expr: body matches "^\\{"
              output: parser-docker
            - expr: body matches "^[^ Z]+ "
              output: parser-crio
            - expr: body matches "^[^ Z]+Z"
              output: parser-containerd
          type: router
        - id: parser-crio
          regex: ^(?P<time>[^ Z]+) (?P<stream>stdout|stderr) (?P<logtag>[^ ]*) ?(?P<log>.*)$
          timestamp:
            layout: 2006-01-02T15:04:05.999999999Z07:00
            layout_type: gotime
            parse_from: attributes.time
          type: regex_parser
        - combine_field: attributes.log
          combine_with: ''
          id: crio-recombine
          is_last_entry: attributes.logtag == 'F'
          max_log_size: 102400
          output: extract_metadata_from_filepath
          source_identifier: attributes["log.file.path"]
          type: recombine
        - id: parser-containerd
          regex: ^(?P<time>[^ ^Z]+Z) (?P<stream>stdout|stderr) (?P<logtag>[^ ]*) ?(?P<log>.*)$
          timestamp:
            layout: '%Y-%m-%dT%H:%M:%S.%LZ'
            parse_from: attributes.time
          type: regex_parser
        - combine_field: attributes.log
          combine_with: ''
          id: containerd-recombine
          is_last_entry: attributes.logtag == 'F'
          max_log_size: 102400
          output: extract_metadata_from_filepath
          source_identifier: attributes["log.file.path"]
          type: recombine
        - id: parser-docker
          output: extract_metadata_from_filepath
          timestamp:
            layout: '%Y-%m-%dT%H:%M:%S.%LZ'
            parse_from: attributes.time
          type: json_parser
        - id: extract_metadata_from_filepath
          parse_from: attributes["log.file.path"]
          regex: ^.*\/(?P<namespace>[^_]+)_(?P<pod_name>[^_]+)_(?P<uid>[a-f0-9\-]+)\/(?P<container_name>[^\._]+)\/(?P<restart_count>\d+)\.log$
          type: regex_parser
        - from: attributes.stream
          to: attributes["log.iostream"]
          type: move
        - from: attributes.container_name
          to: resource["container"]
          type: move
        - from: attributes.namespace
          to: resource["namespace"]
          type: move
        - from: attributes.pod_name
          to: resource["pod"]
          type: move
        - from: attributes.log
          to: body
          type: move
        - type: json_parser
          if: 'body matches "^{.*}$"'
      poll_interval: 5s
      start_at: end
  service:
    telemetry:
      logs:
        level: debug
    pipelines:
      traces:
        receivers:
          - otlp
        exporters:
          - otlp
      metrics:
        receivers:
          - otlp
      logs:
        receivers:
          - filelog
        processors:
          - resource
          - attributes
        exporters:
          - debug
          - loki
  processors:
    attributes:
      actions:
        - action: insert
          key: loki.attribute.labels
          value: level, context, traceID
    resource:
      attributes:
        - action: insert
          key: loki.format
          value: json
        - action: insert
          key: loki.resource.labels
          value: pod, namespace, container
  exporters:
    loki:
      endpoint: http://loki-gateway/loki/api/v1/push
    otlp:
      endpoint: tempo:4317
      tls:
        insecure: true
    debug:
      verbosity: detailed
ports:
  jaeger-compact:
    enabled: false
  jaeger-thrift:
    enabled: false
  jaeger-grpc:
    enabled: false
  zipkin:
    enabled: false
mode: daemonset
presets:
  logsCollection:
    enabled: true
    includeCollectorLogs: true
이제 Grafana Loki datasource의 설정값을 보면 아래와 같이 설정된 것을 확인할 수 있다. Regex는 항상 정확히 작성하는데 어려움이 있는데, Label을 통해서 가져오는 것이 실수를 방지하고 간단하게 Tempo link를 연결할 수 있다.
결론
많은 OpenSource Contributor들 덕분에 Tracing과 Logging을 쉽게 구성할 수 있었다. Loki에서 Regex로 Trace ID를 추출하고, 그것을 Tempo에서 바로 볼 수 있도록 링크를 달아줄 수 있는 것은 너무나 좋았다. 그리고 OpenTelemetry Collector를 사용하는 상황에서 FluentBit 때신에 Firelog receiver를 이용하는 것도 괜찮겠다는 생각이 들었다. 다양한 Instrumentation library도 체크해봐야겠다. 아직 Production Ready를 위해서는 Loki, Tempo, Open Collector의 가용성을 생각해서 배포도 다시 구성해야하고, 통신간에 TLS와 인증 부분도 추가해야 한다.